

Atmospheric river
Narrow corridor of concentrated moisture in the atmosphere
- 9 min read
- 3 chapters

Related on Lably
Through Atmosphere, Water vapor and Water cycle
Atmospheric rivers consist of narrow bands of enhanced water vapor transport, typically along the boundaries between large areas of divergent surface air flow, including some frontal zones in association with extratropical cyclones that form over the oceans. Pineapple Express storms are the most commonly represented and recognized type of atmospheric rivers; the name is due to the warm water vapor plumes originating over the Hawaiian tropics that follow various paths towards western North America, arriving at latitudes from California and the Pacific Northwest to British Columbia and even southeast Alaska.
Description
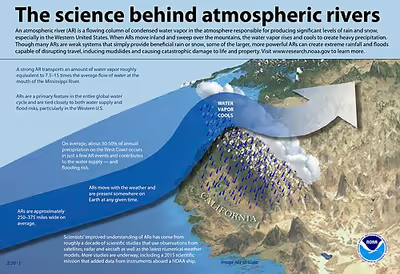
The term was originally coined by researchers Reginald Newell and Yong Zhu of the Massachusetts Institute of Technology in the early 1990s to reflect the narrowness of the moisture plumes involved. Atmospheric rivers are typically several thousand kilometers long and only a few hundred kilometers wide, and a single one can carry a greater flux of water than Earth's largest river, the Amazon River. There are typically three to five of these narrow plumes present within a hemisphere at any given time. These have been increasing in intensity slightly over the past century.
In the current research field of atmospheric rivers, the length and width factors described above in conjunction with an integrated water vapor depth greater than 2.0 cm are used as standards to categorize atmospheric river events.
A January 2019 article in Geophysical Research Letters described them as "long, meandering plumes of water vapor often originating over the tropical oceans that bring sustained, heavy precipitation to the west coasts of North America and northern Europe." Recent research is focusing now on their global distribution.
As data modeling techniques progress, integrated water vapor transport (IVT) is becoming a more common data type used to interpret atmospheric rivers. Its strength lies in its ability to show the transportation of water vapor over multiple time steps instead of a stagnant measurement of water vapor depth in a specific air column (integrated water vapor – IWV). In addition, IVT is more directly attributed to orographic precipitation, a key factor in the production of intense rainfall and subsequent flooding.
Scale
The Center for Western Weather and Water Extremes (CW3E) at the Scripps Institution of Oceanography released a five-level scale in February 2019 to categorize atmospheric rivers, ranging from "weak" to "exceptional" in strength, or "beneficial" to "hazardous" in impact. The scale was developed by F. Martin Ralph, director of CW3E, who collaborated with Jonathan Rutz from the National Weather Service and other experts. The scale considers both the amount of water vapor transported and the duration of the event. Atmospheric rivers receive a preliminary rank according to the 3-hour average maximum vertically integrated water vapor transport. Those lasting less than 24 hours are demoted by one rank, while those lasting longer than 48 hours are increased by one rank. Using the AR Categorization Toolkit (ARCaT) researchers are able to characterize the category of an AR using the Ralph et al 2019 scale and further track the evolution of the category of an AR at any timestamp.
Examples of different atmospheric river categories include the following historical storms:
- February 2, 2017; lasted 24 hours
- November 19–20, 2016; lasted 42 hours
- October 14–15, 2016; lasted 36 hours and produced 5–10 inches of rainfall
- January 8–9, 2017; lasted 36 hours and produced 14 inches of rainfall
- December 29, 1996 – January 2, 1997; lasted 100 hours and caused >$1 billion in damage
Typically, the Oregon coast averages one Cat 4 atmospheric river (AR) each year; Washington state averages one Cat 4 AR every two years; the San Francisco Bay Area averages one Cat 4 AR every three years; and southern California, which typically experiences one Cat 2 or Cat 3 AR each year, averages one Cat 4 AR every ten years.
Usage: In practice, the AR scale can be used to refer to "conditions" without reference to the word "category", as in this excerpt from the CW3E Scripps Twitter feed: "Late-season atmospheric river to bring precipitation to the high elevations over northern California, western Oregon, and Washington this weekend, with AR 3 conditions forecast over southern Oregon."
Sign in to keep reading
2 more chapters are free with a Lably account.
Impacts
Atmospheric rivers have a central role in the global water cycle. On any given day, atmospheric rivers account for over 90% of the global meridional (north-south) water vapor transport, yet they cover less than 10% of any given extratropical line of latitude. Atmospheric rivers are also known to contribute to about 22% of total global runoff.
They are also the major cause of extreme precipitation events that cause severe flooding in many mid-latitude, westerly coastal regions of the world, including the west coast of North America, Western Europe, the west coast of North Africa, the Iberian Peninsula, Iran and New Zealand. Equally, the absence of atmospheric rivers has been linked with the occurrence of droughts in several parts of the world, including South Africa, Spain and Portugal.
United States
The inconsistency of California's rainfall is due to the variability in strength and quantity of these storms, which can produce strenuous effects on California's water budget. The factors described above make California a perfect case study to show the importance of proper water management and prediction of these storms. The significance that atmospheric rivers have for the control of coastal water budgets juxtaposed against their creation of detrimental floods can be constructed and studied by looking at California and the surrounding coastal region of the western United States. In this region atmospheric rivers have contributed 30–50% of total annual rainfall according to a 2013 study. The Fourth National Climate Assessment (NCA) report, released by the U.S. Global Change Research Program (USGCRP) on November 23, 2018 confirmed that along the U.S. western coast, landfalling atmospheric rivers "account for 30%–40% of precipitation and snowpack. These landfalling atmospheric rivers "are associated with severe flooding events in California and other western states."
The USGCRP team of thirteen federal agencies—the DOA, DOC, DOD, DOE, HHS, DOI, DOS, DOT, EPA, NASA, NSF, Smithsonian Institution, and the USAID—with the assistance of "1,000 people, including 300 leading scientists, roughly half from outside the government" reported that, "As the world warms, the "landfalling atmospheric rivers on the West Coast are likely to increase" in "frequency and severity" because of "increasing evaporation and higher atmospheric water vapor levels in the atmosphere."
Based on the North American Regional Reanalysis (NARR) analyses, a team led by National Oceanic and Atmospheric Administration's (NOAA) Paul J. Neiman, concluded in 2011 that landfalling ARs were "responsible for nearly all the annual peak daily flow (APDF)s in western Washington" from 1998 through 2009.
According to a May 14, 2019 article in San Jose, California's The Mercury News, atmospheric rivers, "giant conveyor belts of water in the sky", cause the moisture-rich "Pineapple Express" storm systems that come from the Pacific Ocean several times annually and account for about 50 percent of California's annual precipitation and are often associated with baroclinic Rossby waves. University of California at San Diego's Center for Western Weather and Water Extremes's director Marty Ralph, who is one of the United States' experts on atmospheric river storms and has been active in AR research for many years, said that, atmospheric rivers are more common in winter. For example, from October 2018 to spring 2019, there were 47 atmospheric rivers, 12 of which were rated strong or extreme, in Washington, Oregon and California. The rare May 2019 atmospheric rivers, classified as Category 1 and Category 2, are beneficial in terms of preventing seasonal wildfires but the "swings between heavy rain and raging wildfires" are raising questions about moving from "understanding that the climate is changing to understanding what to do about it."
Atmospheric rivers have caused an average of $1.1 billion in damage annually, much of it occurring in Sonoma County, California, according to a December 2019 study by the Scripps Institution on Oceanography at UC San Diego and the US Army Corps of Engineers, which analyzed data from the National Flood Insurance Program and the National Weather Service. Just twenty counties suffered almost 70% of the damage, the study found, and that one of the main factors in the scale of damage appeared to be the number of properties located in a flood plain. These counties were:
- Snohomish County, WA ($1.2 billion)
- King County, WA ($2 billion)
- Pierce County, WA ($900 million)
- Lewis County, WA ($3 billion)
- Cowlitz County WA ($500 million)
- Columbia County, OR ($700 million)
- Clackamas, County, OR ($900 million)
- Washoe County, NV ($1.3 billion)
- Placer County, CA ($800 million)
- Sacramento County, CA ($1.7 billion)
- Napa County, CA ($1.3 billion)
- Sonoma County, CA ($5.2 billion)
- Marin County, CA ($2.2 billion)
- Santa Clara County, CA ($1 billion)
- Monterey County, CA ($1.3 billion)
- Los Angeles County, CA ($2.7 billion)
- Riverside County, CA ($500 million)
- Orange County, CA ($800 million)
- San Diego County, CA ($800 million)
- Maricopa County, AZ ($600 million)
Canada
According to a January 22, 2019 article in Geophysical Research Letters, the Fraser River Basin (FRB), a "snow-dominated watershed" in British Columbia, is exposed to landfalling ARs, originating over the tropical Pacific Ocean that bring "sustained, heavy precipitation" throughout the winter months. The authors predict that based on their modelling "extreme rainfall events resulting from atmospheric rivers may lead to peak annual floods of historic proportions, and of unprecedented frequency, by the late 21st century in the Fraser River Basin."
In November 2021, massive flooding in the Fraser River Basin near Vancouver was attributed to a series of atmospheric rivers. In British Columbia, the mid November 2021 atmospheric river produced severe flooding through a combination of intense precipitation, rain on snow events, and snowmelt in parts of the Fraser River basin.
Iran
While a large body of research has shown the impacts of the atmospheric rivers on weather-related natural disasters over the western U.S. and Europe, little is known about their mechanisms and contribution to flooding in the Middle East. However, a rare atmospheric river was found responsible for the record floods of March 2019 in Iran that damaged one-third of the country's infrastructures and killed 76 people.
That AR was named Dena, after the peak of the Zagros Mountains, which played a crucial role in precipitation formation. AR Dena started its long, 9000 km journey from the Atlantic Ocean and travelled across North Africa before its final landfall over the Zagros Mountains. Specific synoptic weather conditions, including tropical-extratropical interactions of the atmospheric jets, and anomalously warm sea-surface temperatures in all surrounding basins provided the necessary ingredients for formation of this AR. Water transport by AR Dena was equivalent to more than 150 times the aggregated flow of the four major rivers in the region (Tigris, Euphrates, Karun and Karkheh).
The intense rains made the 2018-2019 rainy season the wettest in the past half century, a sharp contrast with the prior year, which was the driest over the same period. Thus, this event is a compelling example of rapid dry-to-wet transitions and intensification of extremes, potentially resulting from the climate change.
Australia
In Australia, northwest cloud bands are sometimes associated with atmospheric rivers that originate in the Indian Ocean and cause heavy rainfall in northwestern, central, and southeastern parts of the country. They are more frequent when temperatures in the eastern Indian Ocean near Australia are warmer than those in the western Indian Ocean (i.e. a negative Indian Ocean Dipole). Atmospheric rivers also form in the waters to the east and south of Australia and are most common during the warmer months.
Europe
According to an article in Geophysical Research Letters by Lavers and Villarini, 8 of the 10 highest daily precipitation records in the period 1979–2011 have been associated with atmospheric rivers events in areas of Britain, France and Norway.
Satellites and sensors
According to a 2011 Eos magazine article by 1998, the spatiotemporal coverage of water vapor data over oceans had vastly improved through the use of "microwave remote sensing from polar-orbiting satellites", such as the special sensor microwave/imager (SSM/I). This led to greatly increased attention to the "prevalence and role" of atmospheric rivers. Prior to the use of these satellites and sensors, scientists were mainly dependent on weather balloons and other related technologies that did not adequately cover oceans. SSM/I and similar technologies provide "frequent global measurements of integrated water vapor over the Earth's oceans."