

Climate change in Norway
Emissions, impacts and response of Norway related to climate change
- 34 min read
- 6 chapters

Related on Lably
Through Climate change, Middle East and Biodiversity
On a per-capita basis, Norway is the world's largest producer, and exporter, of oil and natural gas outside the Middle East. In 2016, 56 new licenses for oil exploration near the Lofoten Islands were issued. However, 98% of Norway's electricity demand is supplied by renewable sources, mostly from hydroelectric power, generated using Norway's extensive freshwater reserves. Emissions are also generated through transportation, although Norway is a world leader in electric vehicles.
Warmer temperatures in Norway are causing permafrost and glaciers to retreat, and leading to shifts in precipitation patterns. Climate change is particularly impacting Norway's Arctic region. Biodiversity and forested areas are experiencing shifts due to the phenomenon, with significant implications for the agriculture and economy of the country. Indigenous Sámi people's practices are being impacted by climate change.
Norway's government have introduced several social and economic policies towards climate change mitigation, including through carbon capture and storage. Norway wants to achieve carbon neutrality by 2030, partly by investing in projects with emissions reduction abroad. It wants to achieve zero emission in the country by 2050. In 2020, Norway pledged to achieve a 50% - 55% reduction in domestic emissions from the level of 1990 by 2030.
Greenhouse gas emissions
Energy consumption
In 2015, Norway's energy supply reached 1.7 million tonnes – a 311.3% increase since 1990 - and their total domestic consumption was 213 terawatt-hours (TWh) in 2015, of which 89 TWh were used by households and services. This was a 2% increase in household consumption, which has been attributed to lower temperatures causing a rise in demand for heating, which also led to a 7% rise in biofuel use from 2014. Due to rising global demand in natural gas and oil, 56 new licences were issued in January 2016 to allow more oil exploration near the Lofoten islands, in addition to the North and Barents seas. This poses a threat to biodiversity and fish stocks in these areas despite numerous promises to improve their environmental ratings and the Paris pledge. On the other hand, 98% of Norway's electricity demand is supplied by renewable energies, 95% of this comes from hydroelectric power. Because of the knowledge that their electricity is supplied by renewable sources and its very low cost as it is produced domestically, consumption in Norway is three times higher than the average European. Electricity consumption equates to approximately 77% of household energy usage in an average detached house.
In 2023, Norway achieved a notable 4.7% reduction in emissions, decreasing from 48.9 million metric tons of CO2 equivalent in the previous year to 46.6 million tons. This progress is part of a continuing trend, with the peak emissions since 1990 recorded in 2007 at 56.5 million tonnes. A significant factor in the recent reduction has been the decreased emissions from car traffic, largely attributed to the increased adoption of electric vehicles (EVs) and the integration of biofuels.
Transportation
The transportation sector accounts for one-third of the total greenhouse gas emissions produced in Norway (~16.5 million tons of CO2), with road traffic accounting for ~10 million tons of CO2. Norway's transport mix is heavily influenced by its low population density, narrow shape and long coastline with many small islands. The Norwegian Ministry of Transport and Communications has overall responsibility for the civil aviation, public roads and rail transport sector, ferry services forming part of the national road system (i.e. coastal regions), for coastal management, the marine environment and port and sea transport policy. They also have the ability to delegate tasks related to public transport and roads to the designated counties and municipalities. The majority of infrastructure in Norway is publicly owned, with operations often contracted out to private firms.
Public transport in and around urban populations is well developed, particularly in Oslo which has one of the most advanced public transportation systems in Europe boasting metro, bus, tram and ferry networks that are all integrated on a zone-based fare system with the latest technology. However, regions with low populations do often lack public transport infrastructure, forcing inhabitants to have their own car. Public transport is subsidized by the government.
Rail transport
Trains produced ~18-36g/km of CO2, depending on capacity of the train. The main railway network in Norway consists of 4,087 km (2,556 mi) of standard gauge lines, of which 242 km (150 mi) is double track and 64 km (40 mi) is high-speed rail (with speeds up to 210 km/h). 2,622 km (64%) is electrified through a 15 kV 162⁄3 Hz AC with overhead wires. This enables significant reductions in greenhouse gas emissions given that 98% (134TWh) of Norway's electricity sector is power by renewable energy (129TWh or 95% of which is produced by hydroelectricity). The only sections that are not electrified are the lines north of Miøsa (except the Dovre and Ofoten Line). Diesel locomotives run the non-electrified sections. All of the urban railways use 750 V DC via overhead wires on the tramways and third rail on the Oslo T-bane. The railways transported 73,836,237 passengers’ 3,555 million km in 2015, with the transport of goods seeing 31,585,437 tons of cargo 3,498 million km.
Road transport
Cars
Norway's fleet of electric cars is one of the cleanest in the world due to its high abundance of electricity generated by hydropower (98%). This has steadily grown in interest, with the end of 2016 seeing 5% (135,000) of all passenger cars on Norwegian roads being a plug-in (Figure 2). Government incentives include being exempt from all non-recurring vehicle fees (including purchase tax and 25% VAT on purchase), a tax reduction for plug-in hybrids and free access to road ferries. These in certain municipalities they can park for free and use public transport lanes. This successful integration of policies has seen electric vehicles widely accepted in Norway and the public even had the chance to discuss and propose ideas for the governments National Transport Plan (NTP). This led to the NTP setting the goal that all new cars; buses and light commercial vehicles should be zero emission vehicles (i.e. all-electric or hydrogen powered) by 2025. However, there have been some side effects with excessively high public subsidies, increased traffic congestion in public transport lanes, shortage of parking spaces for conventional cars (intentional) and loss of revenue for ferry operators.
About half of new cars in Norway in January–June 2019 were electric cars and a quarter in the same period 2018. As of March 2020, 55.9% of the car sales in Norway were electric cars, 26.4% were hybrids (with or without plugs). By 2023, electric cars constituted 24% of all personal vehicles on Norwegian roads.
Buses
Each county is responsible for the public bus and boat transport in their area, with railways, regional airlines and the Coastal boat all being financed by the state. In 2015, buses transported 356 million passengers over 4 billion passenger km. In an attempt to meet their plan to be carbon-neutral by 2050 (conditional for 2030) Oslo is also converting municipal buses to run on biomethane captured from human waste in order to cut CO2 emissions (saves 44 tons of CO2 per bus per year compared to gas alternatives).
Civil aviation
Civil aviation produced ~220-455g/km of CO2, depending on capacity of the plane. Norway has 98 airports, of which 51 facilitate public flights, including one heliport. 45/51 are owned by the government through it airport operator, Avinor. Norway is the country in Europe with the most airline trips per capita, and the routes from Oslo to Trondheim, Bergen and Stavanger are all amongst the ten busiest in Europe. Contributing factors include poor rail and road infrastructure in areas with a low population density, rugged geography and a limited population in the interior and north. The main gateway by air to Norway is Oslo Airport (Gardermoen), located 50 km north of Oslo and primarily services both major Norwegian airlines; Scandinavian Airlines System and Norwegian Air Shuttle.
Water transport
Car ferries are vital links across fjords and to islands where there is no fixed connection. There are currently over one hundred car ferry connections in Norway. In 2015, boats transported 11 million passengers to their destination, a 10% growth from 2014. Norway even has started to install battery-electric ferries and has plans to expand the current fleet, powered by the large amount of hydroelectricity. The Coastal Express (known as Hurtigruten) operates daily from Bergen to Kirkenes, stopping at 35 ports. This is pleasing news on a regional and national level but fails to address their huge international fleet as shipping and aircraft regulations where notably absent from the Paris Agreement.
Fossil fuel production
Norway has a strong ranking of 17 out of 180 countries analyzed in 2016. However, it is one of the world's largest oil exporter and has the largest sovereign fund of any country. In 2015, Norway produced 53.9 million tonnes of greenhouse gases (GHGs) with 15.1 million tonnes attributed to oil and gas extraction. This was higher than any other source of emissions, including energy supply, agriculture and road traffic. The total emissions of GHGs increased by 600,000 tonnes since 2014, with emissions from oil and gas extraction increasing by 83.3% since 1990. In more detail, a 25% increase CO2 emissions, 10% decrease in methane, 38% decrease in nitrous oxide; 44.7 million tonnes (Mt) was CO2, 5.5 Mt of CH4, 2.6 Mt of N2O (Figure 1).
The petroleum and natural gas production on the Norwegian continental shelf utilizes pipelines totaling 9,481 km to transport products to processing plants and onwards to other European countries.
Industrial emissions
Mining and quarrying
12 million tonnes of CO2 equivalents and 66 TWh were used by the manufacturing mining and quarrying industry in 2015 - a 39% emissions reduction since 1990, second only to oil and gas extraction. This industry is showing a downward trend in emissions, but there was an increase between 2014 and 2015 of 3.1%.
Agriculture
Higher production and use of fertilizer in 2015 contributed notably to higher CO2 and nitrous oxide emissions, which was also the largest proportion of agricultural emission causes. The agricultural sector emitted 4.5 million tonnes of CO2 equivalents, but these emissions have been steadily decreasing since 1967.
Sign in to keep reading
5 more chapters are free with a Lably account.
Impacts on the natural environment
Temperature and weather changes
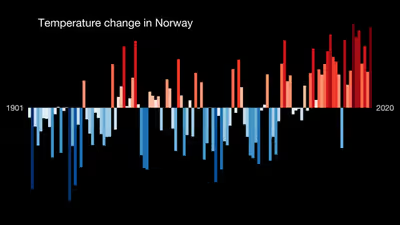
All climate scenarios indicate that all season in all regions of Norway will become warmer this century. Low, mean and high projections depict the annual mean temperature rising by 2.3 °C, 3.4 °C and 4.6 °C respectively by 2100 (Table 1). For the mainland, the smallest increase is expected in Western Norway 3.1 °C (1.9-4.2 °C), with the highest being in the northernmost country (Finnmark) of 4.2 °C (3.0-5.4 °C). This is expected to be even larger in offshore territories such as Svalbard and Jan Mayen, some predictions as high at 8 °C.
The largest increase is projected during winter, whilst the smallest will occur during summer. This will see an increase in the growing season and corresponding decrease in snow cover over large parts of the country. Hence, warmer seasons will increase in length, whilst winter will become shorter and more sporadic depending on given temperature regions.
Thawing permafrost
Permafrost is defined as ground, soil or rock, including ice or organic material that remains at or below zero degrees Celsius for at least two consecutive years. The regions in which permafrost occurs occupy ~24% (23 million km2) of the Northern Hemisphere. Modelling suggests that permafrost covers have been warming and thawing since the end of the Little Ice Age c. 120 years ago. Access the current global distribution of permafrost here.
Permafrost plays three important roles in the context of climate change; a mechanism for temperature archives, a translator of global warming through subsidence and related impacts and a facilitator of further change through its effect on the global carbon cycle (Figure 2).
Due to its climate setting (mild winters, cool summers), mountain permafrost is the dominating permafrost type. In Southern Norway, the lower permafrost extends from 1300 to 1600 metres above sea level (masl). Whilst in the north, mountain permafrost begins around 900masl in the west and as low as 400masl in the east (Finnimark county). The archipelago of Svalbard is also covered by approximately 60% of continuous permafrost and is the only landscape in Scandinavia where people are living directly on permafrost.
Ground temperature measurements taken by The University of Oslo and the Meteorological Institute have shown an increase of 1 °C since 1999, with clear evidence of permafrost degradation in test sites shown by the Norwegian Permafrost Database (NORPERM). The lower limit of mountain permafrost are highly sensitive to global warming as their permafrost temperatures are already just below 0 °C and will thaw if current trends continue.
Already the wetland areas of northern Norway (palsas and peat plateaus) have air photo and field analysis showcasing reductions of up to 50% in ground ice cover since the 1950s. This results in a considerable loss of permafrost and may trigger an increased emission of greenhouse gases (positive-feedback mechanism) from previously frozen, but now degrading organic material.
Most of the permafrost in Norway is situated in uninhabited areas making the impact on society limited. However, glaciations and glacier erosion helped have sculpted mountain areas in Norway, revealing many steep and unstable slopes (i.e. Mt.Nordnes northeast of Tromsø). These slopes tend to lie in the permafrost area and failure of such slopes could affect roads, towns and even trigger localised tsunamis if large rock masses hit fjords or lakes.
Melting has even recently caused the Global Seed Vault, buried in a mountain deep inside the Arctic Circle, to be breached after global warming produced extraordinary temperatures over the winter, sending meltwater gushing into the entrance tunnel. Continued melting will cause gas and oil pipelines to crack and buildings to slowly fall apart due to unstable ground.
Glacial retreat
Most of the glaciers in the Norwegian Arctic are found in Svalbard, where glaciers have a total volume of ~7,000km3 and an area of 36,000km2. On the mainland glaciers only have a volume of 64km3 and an area of 1,000km2. The glaciers in Svalbard are key contributors to sea level rise as the archipelago accounts for 11% of Arctic land ice, apart from Greenland. Melting in Svalbard is extensive and is in line with both Arctic and global trends.
Knowledge of glacier volume and ice thickness distribution is important for assessing the cryospheric contribution to sea-level rise, glacier response to global warming and water resource management at the local to national level in Norway. When glaciers melt the white surface of the glaciers that normally reflects solar radiation becomes exposed (underlying dark surfaces), causing a positive feedback mechanism and hence further melting and increase in temperatures.
Having experienced a brief period of expansion between 1940 and the 1990s as a response to higher winter accumulation, Norwegian glaciers have continued retreating as a result of less snowfall and higher summer temperatures (=more melting). This has led to long-term forecasts where it is expected to see a summer temperature increase of at least 2.3 °C and a significant increase (~16%) by the end of the 21st century. As a result, ~98% of the Norwegian glaciers are likely to disappear and the glacier area may be reduced by ~34% by 2100. This is in line with global glacier volume dramatically decreasing over the rest of the 21st century.
Precipitation patterns
Strong westerly winds bring moist air masses from the ocean and fall in the form of rain/snow to most of Norway. However, this does vary greatly from coastal areas that could receive more than 3500mm annually down to 300mm in south-eastern Norway and Finnmarksvidda where they are on the leeward side of mountain ranges.
Modelled climate data expects mainland Norway to experience annual precipitation increases of around 18% (5-30%) up to 2100, with respect to 1961–1990. The largest variation is expected in autumn (+23%) as precipitation starts to fall as rain rather than snow, with the lowest being in summer 9% (-3 to 17%) as nearly all precipitation already falls in the form of rain. Projections also indicate more days with heavy rainfall and precipitation values in the extreme events all over Norway and in all seasons. This is particularly relevant during winter and autumn where the number of days with heavy rainfall is expected to double.
The long-term outlook for the snow season is that it will become increasingly shorter over the century. A reduction of 2-3 month is estimated for low-elevation and coastal areas in west, mid and north Norway (when comparing current (1961-1990) and future climate data (2071-2100)). As winters become shorter, snowfall in autumn and spring will reduce. The decrease in total annual snowfall is smaller with increasing altitude and distance from the coast. Highly mountainous areas may experience slight increases in snowfall. Norjan järvihistoria kollaasi:/sanomlaéhti 40 years
The current trends over the last 40 years is unprecedented and if continued Norway would experience annual precipitation changes of 30% over a century. This is 2-3 times higher than predicted.
Wind speed
Future projections to the year 2100 (compared with 1961–1990) indicate small or no changes for average wind speed. Changes are expected to stay within the range of natural variability and have different effects depending on the scenario. Extreme geostrophic wind speeds are expected to experience a 2-6% decrease over the Norwegian Sea, whereas southern and eastern parts of Northern Europe will see an increase of 2-4%.
Sea-level rise
In comparison to other parts of the world, Norway and Svalbard will not experience any dramatic effects from a rise in sea level, as the land is still rising after the previous Ice Age and the coast is relatively steep.
At the end of the previous Ice Age, a layer of ice up to 3 km thick covered parts of northern Europe and North America. When the ice melted, the significant weight of the ice layer that pushed the Earth's crust down into the mantle began to rise again. Land uplift was greatest immediately after the ice melted, however, it is estimated to continue rising for another 10,000 years.
Studies suggest that Norway will experience an approximately 10 cm greater rise in sea level than the global average within the year 2100. Despite great uncertainty from all data, the IPCC calculated a global increase of 10–90 cm during this century. Other studies conducted by the NOU Climate Adaptation in 2009 suggest a 40–95 cm rise in sea level in northern Norway up until 2100, corrected for land uplift. This makes infrastructure long the coast more vulnerable to damage, especially during storm surges.
Ecosystems
Agricultural land vs forests
Agricultural areas account for 3% of the mainland, while the forests are about 37%. Around 47% of the land is located above the tree line.
Studies have demonstrated that future long-term warming trends may lead to a longer growing season and hence increasing agricultural yields. This effect would increase progressively from south to north. In Northern Norway this is projected to be in the order of an increase of 1–4 weeks for the period 2021–2050, compared with 1961–1990. A longer season could also increase the use of legumes and more productive perennial forage grasses, vegetables and grains.
The relationship between a longer growing season and agriculture is not linear. An extended growing season is still limited by the reduced photoperiod, which terminates growth irrespective of the temperature increase. Thus, there needs to be both prolonged autumn and earlier spring to promote longer growing seasons, whilst taking the risk of frost into account. Frost on snow-free soil leads to thick layers of frozen soil that can prolong lower soil temperatures irrespective of other factors that favor an early start to the season. Increased precipitation in autumn could also complicate harvesting and agricultural practices.
The agricultural industry is already exposed to several other issues that could be compounded by global warming. Those are that the farming population is ageing with the younger generation flocking to cities for education and other forms of employment. Furthermore, any reductions in agricultural subsidies and lack of increases in real incomes for farming may exacerbate the problem even further.
The most obvious change in forestry will be the expansion of coniferous forests. They will spread northwards and to higher elevations in the next century due to increasing temperatures. Birch forests are expected to exhibit similar trends. This will result in a considerable increase in forested area in northern Norway. A temperature increase of 2 degrees Celsius can move the tree line up the mountainside by about 300 m.
Biodiversity
The Norwegian Arctic is getting warmer and wetter, with large local variations. This is already having observed effects on almost all ecosystems. One is a terrestrial ecosystem, which has led to the earlier migration of birds, earlier sexual maturation in some animals, higher production and reproduction in both plants and animals, and earlier budding and pollen production. This is also evident in forests as warming temperatures leads to a higher tree line. The result of this is an expansion both northwards and upwards of species, particularly coniferous and birch forests. This movement will also cause northern boreal forests to invade tundra ecosystems in the long-term future.
Whilst heat-stress is not expected to become a large issue on land, particularly in Northern Norway, warmer conditions will support the spread of disease-bearing insects (especially those limited by the cold temperatures) and invasive species into Norway, thus increasing the vulnerability of native species, livestock and the human population alike.
Rising temperatures have affected local Norwegian ecosystems in many ways. Sea ice is diminishing, threatening ice-dependent species quicker than first imagined. The absence of sea ice leads to more rapid warming, due to the feedback mechanisms associated with the absorbance of sunlight. It also leads to a reduction in biodiversity, as several species are dependent on sea ice. For example, ice algae that grow in and under the ice, seals that need sea ice to give birth to their young, polar bears that prey on seals and several species of bird too.
The rising temperatures are having direct impacts on freshwater and wetlands biodiversity. Atlantic salmon is a keystone species in rivers along the coast of Norway. Salmon have an upper temperature limit in the twenties so future warming may make it increasingly difficult to maintain current population levels. Higher initial temperatures could lead to increased growth and production in the short-term but ultimately there could be a massive collapse if warming trends continue. This has been made evident by the recent decline in mean individual mass and annual mean length of the fish. It is suggested that the size change of Atlantic salmon is made by the collapse and rebuilding of the pelagic fish abundance in the North Atlantic Ocean, a gradual decrease in zooplankton abundance and climate change. It could also promote genetic abnormalities and the spread of disease such as Pancreas Disease (PD) and Infectious Salmon Anemia Virus (ISA). Furthermore, lake and river surface water temperatures are projected to increase further, resulting in a longer summer stratification period and more cyanobacterial blooms. Furthermore, both the Atlantic salmon and the Arctic charr have experienced changes in abundance. Whilst both species coexist it has been the Arctic charr who seems to be more vulnerable to environmental changes, hence leading to its overall decline in numbers.
A rise in sea temperatures will also affect marine, estuarine and intertidal ecosystems. Warmer seawater can lead to more phytoplankton and zooplankton but it is not known if other species can utilise this increase in food stocks. This change also favours species that prefer warmer waters and they will start to out-compete local species. Additionally, increased CO2 concentrations in the atmosphere are leading to ocean acidification, which is expected to continue over the next century to levels not witnessed in the last 20 million years. This may cause the extinction of coral species as the changing water chemistry makes it increasingly difficult for organisms with calcareous shells to form with calcium.
The Arctic
The Arctic region will warm more rapidly than the global mean, and mean warming over land will be larger than over the ocean, with studies indicating somewhere between 3 and 12 degrees Celsius with a high degree of uncertainty. Over the last two decades Arctic sea ice and Northern Hemisphere spring snow cover has continued to decrease in extent not exhibited in at least the last 1,450 years. This is expected to continue as global mean surface temperatures increase.
The annual mean sea ice extent has decreased in the range of 3.5 to 4.1% per decade (0.45 to 0.51 million square km per decade) over the period 1979–2012. This rate increases to 9.4 to 13.6% per decade (0.73 to 1.07 million square km per decade) for the summer sea ice minimum; hence it is most rapid in summer (Figure 3). Furthermore, IPCCs 5th Synthesis Report illustrates the continued reduction in extent of Arctic July–August–September (summer) average sea ice between 1900 and 2100.
Year-round reductions in Arctic sea ice extent are projected by the end of the 21st century from multi-model averages. These reductions range from 43 to 94% in September and from 8-34% in February. Thus, it is very likely that we will see a nearly ice-free Arctic Ocean in September before mid-century or towards the end of the 21st century depending on our ability to cut greenhouse gas emissions to the atmosphere. This is as anthropogenic influences have very likely contributed to Arctic sea ice loss since 1979.
This is very worrying as sea ice plays a crucial role in regulating the temperature of Earth. Sea ice prevents warming to its high albedo and its ability to reflect the sunlight's rays. However, in the event of less sea ice the ocean then absorbs this heat and continues to increase further warming (positive feedback loop). This affects those animals that rely on sea ice (i.e. polar bears and some seal species).
Impacts on people
Economic impacts
Agriculture
A warmer climate will have its pros and cons for the Norwegian agriculture. Higher temperatures combined with new types of plants adapted to the milder climate may yield larger harvests and possibly making two harvests possible per year. The impact of climate change will vary between regions as there are already today a lot of local differences in precipitation etc. An earlier time of snow melting in areas with a dry climate may lead to crops drying out and dying. In wetter regions, further increased precipitation may cause outbreaks of fungus invasion on crops.
Forestry
The productive forest in Norway is expected to increase considerably due to climate change, but not without complications. Mild winters will reduce the resistance of trees and their frost tolerance. Freeze-thaw cycles will also be more frequent during mild winters, damaging the trees. Pest invasions and diseases are expected to be more frequent as new pests can move rapidly northwards. It is also possible that insects will be able to reproduce one more generation per summer due to higher temperatures, so that for instance the European spruce bark beetle may damage spruce trees with an extra invasion per summer.
Social and cultural impacts
The Sami people maintain large herds of reindeer. As climate change progresses, the winters in Sámi have become less and less predictable. Increased temperatures lead to more frequent icing on the ground, leaving food inaccessible for the reindeer. Having to move the reindeer to new grazing areas is problematic because of conflicts related to area usage. Unstable early winters already present difficulties when moving the reindeer from the winter grazing areas to the summer grazing areas because lakes and rivers do not properly freeze. The increased humidity and temperature can favour insects and parasitic pests that target reindeer. However, the increased temperatures could have some positives for reindeer herding, as there may be increased plant growth and better food availability during summer grazing. Early springs can also extend the summer grazing season.
Mitigation and Adaptation
Policies and legislation
According to the World Economic Forum's Travel and Tourism Competitiveness Report 2015 (biannual report), Norway placed 9/141 in air transport infrastructure, 35/141 in quality of railroad infrastructure, 56/141 in ground and port infrastructure and 74/141 regarding the quality of roads.
However, recognizing that 1/3 of Norway's emissions are from transport, the National Transport Plan (NTP) has outlined specific goals to achieve an emission-free transport system;
By 2025, all new private cars, buses and light commercial vehicles should be zero-emission vehicles. New heavier vans, 75% of new long-distance buses and 50% of new trucks have until 2030 to achieve zero-emissions. Similarly, by 2030 40% of all ships in short sea shipping should be using biofuels or be at or below zero-emissions. Biofuels will annually replace 1.7 billion liters of fossil fuel by 2030. This alone provides a theoretical reduction in GHGs of ~5 million tons of CO2 equivalents.
Greenhouse gas emissions from equipment and raw materials for construction, operation, and maintenance of the infrastructure is targeted to be reduced by 40% by 2030.
Carbon capture and storage (CCS)
Currently, the Norwegian government has set the main goal of its CCS policy to identify measures that can contribute to technology development and cost reductions. Furthermore, they seek to construct at least one full-scale carbon capture demonstration plant by 2020.
This was made evident in their recent feasibility studies whereby the Minister of Petroleum and Energy (overall responsibility), Gassnova SF (project coordinator and capture storage) and Gassco AS (transport) identified three potential sites for full-scale CCS projects; a cement factory in Brevik (Norcem AS), an ammonia plan at Herøys in Porsgrunn (Yara Norge AS) and a waste recovery plant at Klemetsrud (Waste-to-Energy Agency in Oslo). However, both Statoil and Gassnova consider an onshore facility, accessed by ship, and a pipeline to ‘Smeaheia’ to be the best solution for CO2 storage. In their statement they highlight that "the costs for planning and investment for such a chain is estimated at between 7.2 and 12.6 billion kroner (~US$852 and 1492 million) with an uncertainty of +/- 40% or better". Hence, a full-scale project will not be realised until at least 2022.
The Norwegian Government was expected to outline further plans for CCS in the 2017 state budget. CCS is a potential means of mitigating the effects of fossil fuel emissions to global warming and ocean acidification. However, given Norway's power supply is almost 100% renewable (majority coming from hydroelectricity) it is odd that they could also be depicted as world leaders when it comes to CCS technology. This can be explained by several key factors;
- Conflict between the large offshore oil and gas industry whose emissions are growing and the relatively high ambition in environmental protection expected by civil society and outlined in climate and energy policy targets
- During 1997-2005 there was discussions to introduce natural gas plants into the country's previously emissions-free power supply. This led to CCS becoming the only viable solution to overcome this political conflict.
- The realization of enhanced oil recovery (EOR) upon installation of CCS technology led the oil and gas industry-led companies to start up CCS initiatives from the early 1990s (i.e. Statoil's pioneering storage project, separating CO2 from natural gas, at the Sleipner gas field in the North Sea).
Social policy
The Norwegian government is attempting to tackle global warming directly through an array of national and international plans and policies. Norway has long pledged to play a leading role in negotiations towards a more ambitious international climate change agreement, using their starting point as limiting the average rise in global temperatures to no more than 2 degrees Celsius above pre-industrial levels (Figure 4). However, Norway is one of the largest exporters of carbon in traded fuels. On a per capita basis, Norway exports of carbon through traded fuels are five times larger than such exports from any other country in the World. Norway's effective contribution to global warming is a lot greater than emissions that are due to its domestic consumption only.
This became apparent when almost all countries in the world first became parties to the United Nations Framework Convention on Climate Change (UNFCCC) in 1992. Despite global emissions rising since then,
Becoming carbon neutral
On 19 April 2007, Prime Minister Jens Stoltenberg announced to the Labour Party annual congress that Norway's greenhouse gas emissions would be cut by 10 percent more than its Kyoto commitment by 2012, and that the government had agreed to achieve emission cuts of 30% by 2020. He also proposed that Norway should become carbon neutral by 2050, and called upon other rich countries to do likewise. This carbon neutrality would be achieved partly by carbon offsetting, a proposal criticized by Greenpeace, who also called on Norway to take responsibility for the 500m tonnes of emissions caused by its exports of oil and gas. World Wildlife Fund Norway also believes that the purchase of carbon offsets is unacceptable, saying "it is a political stillbirth to believe that China will quietly accept that Norway will buy climate quotas abroad". The Norwegian environmental activist Bellona Foundation believes that Stoltenberg was forced to act due to pressure from anti-European Union members of the coalition government, and called the announcement "visions without content".
In January 2008, the Norwegian government went a step further and declared a goal of being carbon neutral by 2030. But the government has not been specific about any plans to reduce emissions at home; the plan is based on buying carbon offsets from other countries, and little has actually been done to reduce Norway's emissions, apart from a very successful policy for electric vehicles
Norway's long-term goal has remained to become a carbon neutral country by 2050 (with a conditional target of 2030) through the assistance of the EU emissions trading market, international cooperation on emissions reductions, emissions trading and project-based cooperation. This sentiment has been reflected through their ongoing commitments in international agreements as depicted below. However, this has not come without scrutiny as the country is often questioned for buying itself out of burdensome domestic environmental obligations by purchasing international CO2 quotas and offsetting emissions through the EU trading scheme (despite not being a member of the EU).
Sovereign funding
Relevant to social policy considerations is the discussion around the use of The Government Pension Fund Global (GPFG). This is a fund where the surplus profit produced by Norwegian petroleum industry (oil and gas) is deposited. Previously called ‘The Petroleum Fund of Norway’ when it was established in 1990, the fund changed its name in 2006. Norges Bank Investment Management (NBIM) manages the fund, which is part of the Norwegian Central Bank and on behalf of the Ministry of Finance. It is not a normal pension fund in the sense as its financial backing comes from oil profits rather than pensioners. This makes continued investment dependent on the survival of the oil industry, despite the world realizing fossil fuels directly contribute to global warming.
As of April 2017, the fund was valued at US$916.9 billion (NOK 7.827 trillion). This makes it the third largest pension fund in the world behind the Social Security Trust Fund (US – value US$2.837 trillion) and the Government Pension Investment Fund (Japan – US$1.103 trilion).
Due to the large size of the fund compared to the relative low population of Norway (~5.3 million in 2017), the fund has become a hot political issue. This includes whether the petroleum revenues should be used now rather than save for the future and if carrying out spending would cause inflation. Furthermore, there are arguments over whether the high level of exposure (62.5%) to the highly volatile stock market is financially safe or simply appropriate diversification. More importantly, in regards to global warming and ethical issues, the fund has been question on its investment policy.
There is large controversy over the investment policy as current and previous investments have included industries such as arms production, tobacco and fossil fuels. Despite having ethical guidelines that prohibit the investment in companies that directly or indirectly attribute to killing, torture, deprivation of freedom or other violations of human rights, the fund is still allowed to fossil fuel companies and a number of arms-producing companies (excluding nuclear weapons).
In 2014, there was significant pressure leading to a parliament investigation as to whether the fund should divest its coal assets in line with it ethical investment mandate. This resulted the fund divesting from energy companies that derive more than 30% of their revenues from coal, 53 companies in total. There is evidence however, that investment into coal actually grew during this period by simply shifting money to those companies who derive <70% of their revenues from coal (i.e. Glencore, BHP and Rio Tinto). In the same year the fund also increased its stake in 59/90 oil and gas companies in which it holds shares in excess of US$30 billion. This gravely disappointed campaigners who argue it should sell of all investments in the fossil fuel industry as they continue to drive global warming and climate change.
International cooperation
Developed nations like Norway have been instructed to take the lead in reducing their emissions and investing heavily in climate commitments as part of its partnership schemes with developing nations - particularly focusing on clean, renewable energy resources, climate change mitigation/adaptation and food security, primarily funded through the Norwegian Clean Energy for Development initiative launched in 2007 and the International Energy and Climate Change Initiative Energy+ (launched in 2011). For example, in 2010 Norway supported household installation of 80,000 solar home systems in Nepal.
Society and culture
Public perception and activism
There seems to be two stories, one about Norway wanting to be a world leader in global climate change and environmental issues whilst the other tends to favour Norway's oil and gas reserves, claiming that its necessary to extract more oil and gas because of high demand and in order to help the poor who in some parts of the world have no access to energy. This duality therefore sends a very polarised message to the Norwegian public and may be part of the reason why there is a lack of engagement or enthusiasm currently observed around the issue of climate change.
In August 2025, about 200 activists, including Sweden's Greta Thunberg, organized a blockade of the biggest oil refinery in Norway, in Bergen. According to Extinction Rebellion the climate protest is “the largest action in Norwegian history.” Greta Thunberg described the reasons for the non-violent protest as follows: “We are here because there is no future in oil. Fossil fuels lead to death and destruction.” As she added, with so many ongoing crises, it is crucial to ensure "the climate crisis does not disappear into the crowd.” Extinction Rebellion Norway sponsored additional protests later in the week. A representative of Norway's Conservative Party objected to the blockade, arguing it thwarts military efforts against Russian President Vladimir Putin's regime.
The scientific debate
Norwegians are not discussing whether or not climate change exists, as that is considered a certainty. Rather issues arise on the timescales at which human actions are affecting the planet and how quickly our planet responds to significant increases in greenhouse gas emissions, i.e. global warming of surface temperatures. The scientific community has even debated the sustainability of different climate technological solutions in the press, i.e. carbon capture and storage, bioenergy and offshore wind power.
Increasingly, it is Norwegian climate researchers that are depicted as world leaders in several areas and have produced the most number of publications in the world (per capita). This is also demonstrated by the high numbers of Norwegian researchers serving as authors for the Intergovernmental Panel on Climate Change (IPCC) working group reports and other prominent international research organisations.
Research on global warming is often being portrayed through the same journalistic principles as other news stories; newsworthiness and contested phenomena. Despite previous attempts at balanced reporting giving rise to a skewed perception of climate skepticism, the debate over anthropogenic climate change in Norway is quite progressive compared to others. So much so that you don't even see conservative politicians or media commentators question mainstream climate science anymore as to them it is clear that the planet is warming. Moreover, the main debate is centered on the timescale of change due to our impacts.
Public information systems
Norway is a small, politically stable Northern European country with a substantial welfare scheme. The Norwegian media landscape is also based on public and government-funded broadcasting where high uptake is considered important for citizen's knowledge on political issues. This, combined with Norway's access to energy resources, makes it a particularly interesting field of study. This is evident by the huge economic interests associated with the oil and gas industry, leading to the popularity of the Norwegian petro-industrial complex and a public discourse around skepticism towards climate science. On the other hand, Norwegians have had a long history of environmental concern given their stunning nature and widespread popular perception of renewable energy affluence thanks to large hydroelectric resources. This dualism has led to an undercurrent of doubt towards climate change and can pose the question: If the climate issue is such a threat, why aren't the politicians doing anything about it? Nonetheless, the government also gets very little credit for its climate policy.
In the past, most people believed that climate change was real. However, perceptions started to shift thanks to an emphasis on ‘balanced reporting’, whereby accounts of scientific controversy made the public ambiguous as to the urgency of the issue. Shifts in public attitude towards climate change have also been shaped by many other key factors. These include news media coverage of changes in nature (nature drama), coverage of presumed experts’ disagreement about global warming (science drama), critical attitudes toward media, observations of political inaction and consideration with respect to everyday life. This lead some to conclude that there is not a lack of public knowledge surrounding global warming, rather that translating this knowledge into action can be regarded as problematic. People often indicated that their behaviour was constrained by a lack of infrastructure and mechanisms, higher prices of environmentally friendly goods, current design promoted private car usage and a lack of disincentives to pollute.
Furthermore, a lack of strong proactive policies by the government has fostered widespread frustration within the public arena, as messages of how to address global warming and climate change are often inconsistent. On the one hand it advocated for geographically remote technical fixes (i.e. CCS and biofuels), whilst on the other hand, the public was asked to take on the prime responsibility of reducing emissions. This mentality that there is a lack of visible political action is then often hard to change.
Examples of this include public calls for comprehensive policies for electric road transport (currently in force), better and cheaper modes of public transport, political guidance concerning energy efficiency in buildings and willingness to develop renewable energy technologies. This led a study on young people to conclude that individual actions did "not matter much in the global context" and that authorities did not facilitate "contributions from ordinary citizens". Furthermore, they highlighted that they think Norway does have a responsibility to help poor countries but also must mitigate the problem and reduce its own oil production simultaneously.
Another strand of research related to climate policy analysed whether support for international climate action is conditional on perceptions of reciprocity. Some studies also suggest that public support for international climate change is more conditional in Norway than in the US or Canada, leading one to suggest that country size and dependence on fossil fuels may be more important than national traditions for multilateral cooperation in predicting unilateral climate action support. The latest opinion polls in Norway however have seen climate change jump to be the second-most important issue on the public's agenda. This is up from sixth place in 2010–2014.
Svalbard
The Arctic region is particularly vulnerable to climate change because the surface air temperatures are increasing at twice the global rate. The special climate of Svalbard – which includes the winter with perpetual darkness (October–February) and summer with perpetual light (April–August) – has a clear effect on the ecology, with many of the endemic species specially adapted to survive the harsh environment.
Svalbard also has among the world's fastest-moving glaciers. Since the landmass is warming at double the global rate, the sheer amount of spring meltwater that runs under the ice lubricates the bedrock enough to make the glaciers surge forward at 25 meters per day during the warm periods.