


Related on Lably
Through Asset, Orders of magnitude (numbers) and Gross domestic product
As of 2009, there was $50.7 trillion of debt owed by US households, businesses, and governments, representing more than 3.5 times the annual gross domestic product of the United States. As of the first quarter of 2010, domestic financial assets totaled $131 trillion and domestic financial liabilities $106 trillion. Tangible assets in 2008 (such as real estate and equipment) for selected sectors totaled an additional $56.3 trillion.
Since 2020, Simko et al. have provided updates to the financial position of the United States.
Net worth (or equity)
Net worth is the sum of assets (both financial and tangible) minus liabilities for a given sector. Net worth is a valuable measure of creditworthiness and financial health since the calculation includes both financial obligations and the capacity to service those obligations.
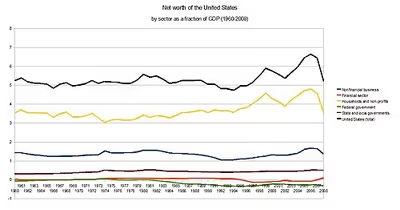
The net worth of the United States and its economic sectors has remained relatively consistent over time. The total net worth of the United States remained between 4.5 and 6 times GDP from 1960 until the 2000s, when it rose as high as 6.64 times GDP in 2006, principally due to an increase in the net worth of US households in the midst of the United States housing bubble. The net worth of the United States sharply declined to 5.2 times GDP by the end of 2008 due to declines in the values of US corporate equities and real estate in the wake of the subprime mortgage crisis and the 2008 financial crisis. Between 2008 and 2009, the net worth of US households had recovered from a low of 3.55 times GDP to 3.75 times GDP, while nonfinancial business fell from 1.37 times GDP to 1.22 times GDP.
The net worth of American households and non-profits constitutes three-quarters of total United States net worth – in 2008, 355% of GDP. Since 1960, US households have consistently held this position, followed by nonfinancial business (137% of GDP in 2008) and state and local governments (50% of GDP in 2008). The financial sector has hovered around zero net worth since 1960, reflecting its leverage, while the federal government has fluctuated from a net worth of -7% of GDP in 1946, a high of 6% of GDP in 1974, to -32% of GDP in 2008.
Sign in to keep reading
4 more chapters are free with a Lably account.
Debt
The Federal Reserve issues routine reports on the flows and levels of debt in the United States. As of the first quarter of 2010, the Federal Reserve estimated that total public and private debt owed by American households, businesses, and government totaled $50 trillion, or roughly $175,000 per American and 3.5 times GDP.
Interest payments on debt by US households, businesses, governments, and nonprofits totaled $3.29 trillion in 2008. The financial sector paid an additional $178.6 billion in interest on deposits.
In 1946, the total US debt-to-GDP ratio was 150%, with two-thirds of that held by the federal government. Since 1946, the federal government's debt-to-GDP ratio has since fallen by nearly half, to 54.8% of GDP in 2009. The debt-to-GDP ratio of the financial sector, by contrast, has increased from 1.35% in 1946 to 109.5% of GDP in 2009. The ratio for households has risen nearly as much, from 15.84% of GDP to 95.4% of GDP.
In April 2011, International Monetary Fund said that, "The US lacks a "credibility strategy" to stabilise its mounting public debt, posing a small but significant risk of a new global economic crisis.
Financial sector
In 1946, the US financial sector owed $3 billion of debt, or 1.35% of GDP. By 2009 this had increased to $15.6 trillion, or 109.5% of GDP.
Most debt owed by the US financial sector is in the form of federal government sponsored enterprise (GSE) issues and agency-backed securities. This refers to securities guaranteed and mediated by federal agencies and GSEs such as Ginnie Mae, Fannie Mae, and Freddie Mac, among others. This group also includes the mortgage pools that are used as collateral in collateralized mortgage obligations. The proportion of financial sector debt owed in the form of GSE and federally related mortgage pools has remained relatively constant – $863 million or 47% of total financial sector debt in 1946 was in such instruments; this has increased to 57% of financial sector debt in 2009, although this now represents over $8 trillion.
Bonds represent the next largest part of financial sector debt. In 1946, bonds represented 6% of financial sector debt, but by 1953 this proportion had risen to 24%. This remained relatively constant until the late 1970s; bonds fell to 14% of financial sector debt in 1981. This coincided with Federal Reserve chairman Paul Volcker's strategy of combating stagflation by raising the federal funds rate; as a result the prime rate peaked at 21.5%, making financing through credit markets prohibitively expensive. Bonds recovered in the 1980s, representing approximately 25% of financial sector debt throughout the 1990s; however, between 2000 and 2009, bonds issued by the financial sector had increased to 37% of financial sector debt, or $5.8 trillion.
Bonds and GSE/federal agency-backed issues represent all but 12% of financial sector debt in 2009.
Households and non-profits
At the end of the second quarter of 2026, households and nonprofit organizations held $217.8 trillion in assets and $21.9 trillion in liabilities, for net worth of $195.9 trillion. Net worth increased by $12.8 trillion during the quarter, primarily because of capital gains on corporate equities. The Federal Reserve combines households and nonprofit organizations in these Financial Accounts figures.
In 1946, US households and non-profits owed $35 billion of debt or 15.8% of GDP. By 2009 this figure had risen to $13.6 trillion or 95.4% of GDP. Home mortgage debt in 1946 represented 66.5% of household debt; consumer credit represented another 24%. By 2009, home mortgage debt had risen to 76% of household debt and consumer credit had fallen to 18.22%. According to the McKinsey Global Institute, the 2008 financial crisis was caused by "unsustainable levels of household debt." The ratio of debt to household income rose by about one-third from 2000 to 2007. The US currently has the twelfth highest debt to GDP ratio among advanced economies.
Nonfinancial business
In 1946, US nonfinancial businesses owed $63.9 billion of debt or 28.8% of GDP. By 2009 this figure had risen to $10.9 trillion or 76.4% of GDP.
State and local governments
In 1946, US state and local governments owed $12.7 billion of debt or 5.71% of GDP. By 2009 this figure had risen to $2.4 trillion or 16.5% of GDP.
In 2016, state and local governments owed $3 trillion and have another $5 trillion in unfunded liabilities.
State and local governments have significant financial assets, totaling $2.7 trillion in 2009. In 2009, these included $1.3 trillion in credit market debt (that is, debt owed by other sectors to state and local governments). These figures do not include state and local retirement funds. State and local retirement funds held $2.7 trillion in assets at the end of 2009.
Federal government
In 1946, the federal government owed $251 billion of debt or 102.7% of GDP. By 2009 this figure had risen to $7.8 trillion, but the federal government's debt-to-GDP ratio had fallen to 54.75%.
In February 2024, the total federal government debt grew to $34.4 trillion after having grown by approximately $1 trillion in both of two separate 100-day periods since the previous June.
The federal government held $1.4 trillion in assets at the end of 2009. This is more than double the assets held by the federal government in 2007 ($686 billion), mainly due to the acquisition of corporate equities, credit market debt, and cash. The federal government held $223 billion in corporate equity at the beginning of 2009; this had fallen to $67.4 billion at the end of that year.
These figures do not include federal government retirement funds. Federal government retirement funds held $1.3 trillion in assets at the end of 2009.
These figures also do not include debt that the federal government owes to federal funds and agencies such as the Social Security Trust Fund. It also does not include "unfunded liabilities" to entitlement programs such as Social Security and Medicare either as debt or accounting liabilities. According to official government projections, the Medicare is facing a $37 trillion unfunded liability over the next 75 years, and the Social Security is facing a $13 trillion unfunded liability over the same time frame.
Negative real interest rates
Since 2010, the U.S. Treasury has been obtaining negative real interest rates on government debt. Such low rates, outpaced by the inflation rate, occur when the market believes that there are no alternatives with sufficiently low risk, or when popular institutional investments such as insurance companies, pensions, or bond, money market, and balanced mutual funds are required or choose to invest sufficiently large sums in Treasury securities to hedge against risk. Lawrence Summers, Matthew Yglesias and other economists state that at such low rates, government debt borrowing saves taxpayer money, and improves creditworthiness. In the late 1940s through the early 1970s, the US and UK both reduced their debt burden by about 30% to 40% of GDP per decade by taking advantage of negative real interest rates, but there is no guarantee that government debt rates will continue to stay so low. In January, 2012, the U.S. Treasury Borrowing Advisory Committee of the Securities Industry and Financial Markets Association unanimously recommended that government debt be allowed to auction even lower, at negative absolute interest rates.
Derivatives
Figures of total debt typically do not include other financial obligations such as derivatives. Partly this is due to the complexities of quantifying derivatives – the United States Comptroller of the Currency reports derivative contracts in terms of notional value, net current credit exposure, and fair value, among others.
The number commonly used by the media is notional value, which is a base value used to determine the size of the cash flows exchanged in the contract. Fair value (or market value) is the value of the contract either on the open market or as it is appraised by accountants. Fair value can be positive or negative depending on the side of the contract the party is on. Credit exposure is defined as the net loss which holders of derivatives would suffer if their counterparties in those derivatives contracts defaulted.
The notional value of derivative contracts held by US financial institutions is $216.5 trillion, or more than 15 times US GDP.
The fair value of US-held derivatives contracts in the first quarter of 2010 was $4,002 billion (28.1% of GDP) for positions with positive values (known as "derivatives receivables"), and $3,886 for positions with negative values (27.3% of GDP). Interest rate derivatives form by far the largest part of US derivative contracts by all measures, accounting for $3,147 billion or 79% of derivatives receivables.
The measure preferred by the Office of the Comptroller is net current credit exposure (NCCE), which measures the risk to banks and the financial system in derivatives contracts. The net current credit exposure (NCCE) of American financial institutions to derivatives in the first quarter of 2010 decreased to $359 billion or 2.5% of GDP, down from $800 billion at the end of 2008 due to the 2008 financial crisis, when it stood at 5.5% of GDP. The difference between the market value of US derivatives and the credit exposure to the financial system is due to netting – financial institutions tend to have many positions with their counterparties that have positive and negative values, resulting in a much smaller exposure than the sum of the market values of their derivative positions. Netting reduces the credit exposure of the US financial system to derivatives by more than 90%, as compared to 50.6% at the beginning of 1998.
Derivatives contracts are overwhelmingly held by large financial institutions. The five largest US banks hold 97% of derivatives by notional value; the top 25 hold nearly 100%. Banks currently hold collateral against their derivative exposures amounting to 67% of their net current credit exposure.
Foreign debt, assets, and liabilities
Foreign holdings of US assets are concentrated in debt. Americans own more foreign equity and foreign direct investment than foreigners own in the United States, but foreigners hold nearly four times as much US debt as Americans hold in foreign debt.
Of all US debt, 15.2% is owed to foreigners. Of the $7.9 trillion Americans owe to foreigners, $3.9 trillion is owed by the federal government. 48% of US treasury securities are held by foreigners. Foreigners hold $1.28 trillion in agency- and government sponsored enterprise-backed securities, and another $2.33 trillion in US corporate bonds.
Foreigners hold 24% of domestic corporate debt and 17% of domestic corporate equity.
Sectoral financial balances
Economist Martin Wolf explained in July 2012 that government fiscal balance is one of three major financial sectoral balances in the U.S. economy, the others being the foreign financial sector and the private financial sector. The sum of the surpluses or deficits across these three sectors must be zero by definition. In the U.S., a foreign financial surplus (or capital surplus) exists because capital is imported (net) to fund the trade deficit. Further, there is a private sector financial surplus due to household savings exceeding business investment. By definition, there must therefore exist a government budget deficit so all three net to zero. The government sector includes federal, state and local. For example, the government budget deficit in 2011 was approximately 10% GDP (8.6% GDP of which was federal), offsetting a capital surplus of 4% GDP and a private sector surplus of 6% GDP.
Wolf argued that the sudden shift in the private sector from deficit to surplus forced the government balance into deficit, writing: "The financial balance of the private sector shifted towards surplus by the almost unbelievable cumulative total of 11.2 per cent of gross domestic product between the third quarter of 2007 and the second quarter of 2009, which was when the financial deficit of US government (federal and state) reached its peak...No fiscal policy changes explain the collapse into massive fiscal deficit between 2007 and 2009, because there was none of any importance. The collapse is explained by the massive shift of the private sector from financial deficit into surplus or, in other words, from boom to bust."
Economist Paul Krugman also explained in December 2011 the causes of the sizable shift from private deficit to surplus: "This huge move into surplus reflects the end of the housing bubble, a sharp rise in household saving, and a slump in business investment due to lack of customers."