

Focal mechanism
Process that generates seismic waves in an earthquake
- 4 min read
- 1 chapter

Related on Lably
Through Earthquake, Fault (geology) and Seismic wave
Moment tensor solutions
The moment tensor solution is displayed graphically using a so-called beachball diagram. The pattern of energy radiated during an earthquake with a single direction of motion on a single fault plane may be modelled as a double couple, which is described mathematically as a special case of a second order tensor (similar to those for stress and strain) known as the moment tensor.
Earthquakes not caused by fault movement have quite different patterns of energy radiation. In the case of an underground nuclear explosion, for instance, the seismic moment tensor is isotropic, and this difference allows such explosions to be easily discriminated from their seismic response. This is an essential part of monitoring to distinguish between earthquakes and explosions for the Comprehensive Test Ban Treaty.
Graphical representation ("beachball plot")
The data for an earthquake is plotted using a lower-hemisphere stereographic projection. The azimuth and take-off angle are used to plot the position of an individual seismic record. The take-off angle is the angle from the vertical of a seismic ray as it emerges from the earthquake focus. These angles are calculated from a standard set of tables that describe the relationship between the take-off angle and the distance between the focus and the observing station. By convention, filled symbols plot data from stations where the P wave first motion recorded was up (a compressive wave), hollow symbols for down (a tensional wave), and crosses for stations with arrivals too weak to get a sense of motion. If there are sufficient observations, one may draw two well-constrained orthogonal great circles that divide the compressive from the tensional observations, and these are the nodal planes. Observations from stations with no clear first motion normally lie close to these planes. By convention, the compressional quadrants are colour-filled, and the tensional is left white. The two nodal planes intersect at the N (neutral)-axis. The P and T axes are also often plotted; with the N axis, these three directions respectively match the directions of the maximum, minimum, and intermediate principal compressive stresses associated with the earthquake. The P-axis is plotted in the centre of the white segment, and the T-axis in the centre of the colour-filled segment.
The fault plane responsible for the earthquake will parallel one of the nodal planes; the other is called the auxiliary plane. It is impossible to determine solely from a focal mechanism which of the nodal planes is the fault plane. Other geological or geophysical evidence is needed to remove the ambiguity. The slip vector, the direction of motion of one side of the fault relative to the other, lies within the fault plane, 90 degrees from the N-axis.
For example, in the 2004 Indian Ocean earthquake, the moment tensor solution gives two nodal planes, one dipping northeast at 6 degrees and one dipping southwest at 84 degrees. In this case, the earthquake can be confidently associated with the plane dipping shallowly to the northeast, as this is the orientation of the subducting slab as defined by historical earthquake locations and plate tectonic models.
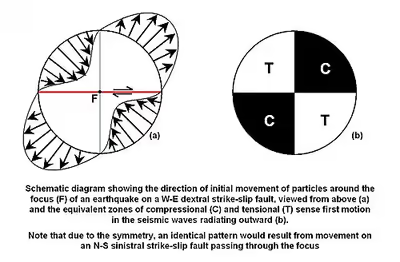
Fault plane solutions are useful for defining the style of faulting in seismogenic volumes at depth for which no surface expression of the fault plane exists or where an ocean covers the fault trace. A simple example of a successful test of the hypothesis of sea floor spreading was the demonstration that the sense of motion along oceanic transform faults is opposite to what would be expected in classical geologic interpretation of the offset oceanic ridges. This was done by constructing fault plane solutions of earthquakes in oceanic faults, which showed beach ball plots of strike-slip nature (see figures), with one nodal plane parallel to the fault and the slip in the direction required by the idea of seafloor spreading from the ridges.
Fault plane solutions also played a crucial role in discovering that the deep earthquake zones in some subducting slabs are under compression while others are under tension.
Beach ball calculator
There are several programs available to prepare Focal Mechanism Solutions (FMS). BBC, a MATLAB-based toolbox, is available to prepare the beach ball diagrams. This software plots the first motion polarity data as it arrives at different stations. The compression and dilation are separated using mouse help. A final diagram is prepared automatically.