


Related on Lably
Through Cuba, Monsoon and Coriolis force
The cyclone was responsible for roughly 600 deaths (with initial reports of up to 1,600), making Matthew the deadliest since Stan in 2005, and caused $15.1 billion (2016 USD) in damages, which made it the costliest since Sandy in 2012. Matthew caused its most destructive entry as it made landfall in Haiti on October 4, causing catastrophic damage and over 500 died as a result. The storm also threatened to be the first major hurricane to strike the United States since Wilma in 2005, however it veered slightly more to the east and remained offshore. The major strike ended up coming a year later. However, torrential rainfall fell in the Carolinas, causing extreme flash flooding. Even as Matthew turned extratropical and moved away from the coast, rivers were still overflowing, and it would take many weeks for the rivers to fall back to average levels. Overall, Matthew caused $10 billion damage in the United States.
Genesis
On September 22–23, a vigorous tropical wave, embedded within the monsoon trough, exited the west coast of Africa over the Atlantic Ocean near Guinea Bissau. The wave coincided with an upper-level trough and an isolated plume of moisture; however, little convection was present. Located unusually close to the equator, roughly 8–10°N, the system was unable to acquire significant spin via the Coriolis force and struggled to develop as it moved rapidly west at 25–30 mph (40–48 km/h). Despite this, the three top forecast models for hurricanes—the GFS, ECMWF, and UKMET—indicated the system would likely become a tropical cyclone over the Caribbean. Two days later, the wave passed south of Cape Verde, and was assessed as having a high probability of tropical cyclogenesis within five days by the National Hurricane Center (NHC). With environmental conditions favoring slow development, thunderstorm activity increased along the wave on September 25, which organized more during the subsequent days while approaching the Lesser Antilles.
By September 27, the wave was producing sustained tropical storm-force winds as reported by the hurricane hunters, although the system lacked the closed circulation required for classification as a tropical cyclone. While the system was passing near Barbados, radar imagery in the Lesser Antilles indicated that the circulation was becoming better organized. Another hurricane hunters flight on September 28 confirmed that a closed circulation developed, recorded surface winds of 58 mph (93 km/h), and observed hurricane-force gusts at the plane's level. These data in conjunction with microwave satellite imagery indicate the system became a tropical cyclone—earning the designation Tropical Storm Matthew—by 12:00 UTC that day; at this time, the storm was centered 20 mi (30 km) west-northwest of Barbados.
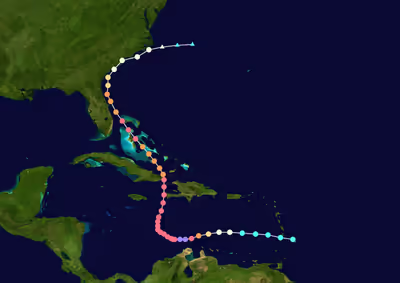
Steered by a strong ridge over the Western Atlantic, Matthew traveled generally west with its center passing between the islands of St. Lucia and St. Vincent before emerging over the Caribbean Sea. Throughout the remainder of September 28, Matthew struggled to develop an inner-core and banding features, preventing intensification. However, deep convection gradually organized around the center. Environmental conditions ahead of the cyclone—including ample moisture fueled by the Intertropical Convergence Zone and high oceanic heat content—favored at least gradual intensification, with the exception of a climatologically unfavorable zone well south of Haiti. Somewhat increased shear on September 29 displaced convection to the east of Matthew's center, leaving behind an exposed circulation. Despite this, aircraft reconnaissance that morning revealed the storm to have deepened somewhat—with a central pressure around 996 mbar (29.41 inHg). Flight level winds increased to 92 mph (148 km/h) and the aircraft's stepped frequency microwave radiometer (SFMR) observed surface winds of 69 mph (111 km/h).
Sign in to keep reading
4 more chapters are free with a Lably account.
Rapid intensification
By 18:00 UTC on September 29, data from aircraft reconnaissance revealed Matthew to have intensified into a hurricane—having sustained winds of at least 74 mph (119 km/h)—by which time the cyclone was located 190 mi (300 km) northeast of Curaçao. Convection soon redeveloped over the hurricane's center and banding features to the east and northeast became better organized. A 25 mi (40 km) wide eye developed over Matthew's center, with reconnaissance, microwave satellite imagery, and radar imagery from Curaçao corroborating the increased organization. Early on September 30, Matthew began a period of rapid intensification despite strong southwesterly wind shear. The system reached Category 2 strength on the Saffir–Simpson scale by 06:00 UTC on September 30. During this time, the mid-level ridge to the hurricane's north shifted into the northern Caribbean, prompting Matthew to take a west-southwest track. Upper-level poleward outflow became established over the circulation while another channel began developing to the southwest; these served to ventilate the hurricane and enable further intensification. By 12:00 UTC, Matthew reached major hurricane status—having sustained winds of at least 111 mph (179 km/h).
Intensifying at an "extraordinary" pace, Matthew reached Category 4 strength by 18:00 UTC. The rapid intensification culminated during the overnight of September 30 – October 1, with Matthew achieving its peak intensity at Category 5 status by 00:00 UTC on October 1, making it the first such storm in the Atlantic basin since Felix in 2007. The hurricane's satellite presentation had markedly improved, with cloud tops colder than −112 °F (−80 °C) in the central dense overcast surrounding a 6 mi (9.7 km) wide eye. Throughout the explosive intensification period, Matthew was embedded within a broad region of 21–25 mph (34–40 km/h) west-southwesterly wind shear, as calculated by the Statistical Hurricane Intensity Prediction Scheme (SHIPS) model using a 1,000 km (600 mi) aerial grid. Shear of this intensity normally prevents or limits storm intensification. Reduction to a 400 km (200 mi) aerial grid in post-storm analysis revealed significantly lower wind shear at a localized level, calculated at 12–17 mph (19–27 km/h). As a result of the over-analyzed wind shear, the NHC did not anticipate the magnitude of Matthew's rapid intensification.
Based on a peak SFMR measurement of 165 mph (266 km/h), the NHC estimated peak winds of 165 mph (265 km/h) with a central pressure of 942 mbar (hPa; 942 mbar (27.82 inHg). At its peak intensity, the storm was centered less than 90 mi (150 km) north of Punta Gallinas, Colombia, at 13.4 degrees north. This made Matthew the southernmost Category 5 hurricane on record in the Atlantic basin, surpassing Hurricane Ivan. Around the time of peak intensity, nighttime visible imagery from the Suomi NPP satellite revealed gravity waves over the hurricane. Matthew featured unusually abundant lightning in its eyewall. Additionally, a rare phenomenon known as lightning sprites were observed above the storm as far away as Puerto Rico. The roles of all three occurrences, if any, in the intensification of Matthew—and tropical cyclones in general—is presently unknown.
The "blob"
For several days in early October, an unusual thunderstorm complex developed to the east of Matthew. The feature drew the attention of meteorologists and was colloquially referred to as the "blob". The complex developed from a convergence zone that developed when southwesterly flow from the hurricane's counter-clockwise circulation interacting with prevailing easterlies over the Caribbean Sea. A vorticity streamer extending from the Andes northward may have played a role in the development of this feature. Dr. Stephanie Zick noted the "blob" was consistent with the stationary band complex described by Willoughby et al. 1984. Intense thunderstorms within the complex, potentially supercells, produced prolific lightning.
Northward turn to Haiti and Cuba
Matthew's tenure at Category 5 status soon ceased as its eye lost definition during the morning of October 1, resulting in slight weakening. Clouds later obscured Matthew's eye and its central pressure rose; however, its core remained incredibly small with an average radius of maximum wind of 8 mi (13 km). Additional weakening took place and peak winds fell to 145 mph (235 km/h) while the central pressure rose to 947 mbar (hPa; 947 mbar (27.96 inHg). Although meteorologists noted the potential for an eyewall replacement cycle that evening, microwave satellite imagery never indicated that one was beginning. The inner core of Matthew proved resilient and the hurricane restrengthened that night; the radius of maximum winds also contracted further to 7 mi (11 km). A NOAA reconnaissance aircraft measured flight-level winds of 155 mph (250 km/h), surface winds of 150 mph (240 km/h), and a central pressure of 940 mbar (hPa; 940 mbar (27.76 inHg) around 21:00 UTC. During this time, the storm's motion became erratic as it entered a weakness in the ridge previously steering it west. It soon executed a small, counter-clockwise loop and turned north.
After briefly remaining stationary, Matthew slowly progressed to the north-northwest early on October 2 between a trough over the Gulf of Mexico and the ridge over the western Atlantic. A large upper-level anticyclone developed over the hurricane and enabled Matthew to remain an intense system throughout the day. A dry slot developed along the southwestern edge of the circulation during the afternoon and some weakening took place; however, the storm's inner-core soon reorganized. Cloud tops cooled around the hurricane's 9 to 14 mi (14 to 23 km) wide eye and reconnaissance aircraft found decreasing central pressures. Concurrently, Matthew attained its secondary peak intensity with winds of 155 mph (250 km/h). For unknown reasons, the southwestern quadrant of the eyewall broke apart during the overnight of October 2–3.
The hurricane's winds oscillated within the Category 4 range for several days as environmental conditions remained conducive to intense hurricanes. In a rare occurrence, Matthew passed directly over a NOAA buoy 42058 at 07:47 UTC; the device measured a pressure of 942.9 mbar (hPa; 9 mbar (0.2658 inHg). Furthermore, it revealed significant upwelling of at least 3 °C (5 °F) which served to limit Matthew's strength. Some intensification took place after the hurricane cleared the region of cooler water, and late on October 3, the hurricane reached its minimum central pressure of 934 mbar (27.58 inHg). The core had enlarged slightly by this time, with an estimated 12 to 17 mi (19 to 27 km) radius of maximum winds. At 11:00 UTC the next day, Matthew made landfall near Les Anglais, Haiti with sustained winds of 150 mph (240 km/h) and a central pressure of 934 mbar (27.58 inHg), making it the strongest hurricane to make landfall in Haiti since Hurricane Cleo in 1964. Despite disruption from the mountainous terrain of Haiti, the hurricane's eye remained well-defined as it traversed the Windward Passage. By 00:00 UTC on October 5, the eye of Matthew made landfall on the eastern tip of the Cuban peninsula near the town of Juaco with winds of 130 mph (210 km/h) and a central pressure near 949 mbar (28.02 inHg). Winds of 124 mph (200 km/h) with gusts to 152 mph (245 km/h) were measured at Punta de Maisí Airport.
The Bahamas and Southeastern United States
Matthew spent roughly five hours over eastern Cuba before emerging over the southwestern Atlantic. The hurricane's eye disappeared from infrared imagery, and it weakened to a Category 3 hurricane, due to the interaction with the terrain of Cuba. Some further weakening occurred as it traversed through the Bahamas – which had previously been pounded by Hurricane Joaquin a little over a year prior at a similar intensity – but began to reintensify, with cooling cloud tops around an eye that was trying to reform. By the next morning, the central pressure had fallen to 944 mbar (27.88 inHg) and the eye reappeared and subsequently warmed. Shortly afterwards, intensification resumed, and Matthew re-strengthened to a Category 4 hurricane later that day. The central pressure fell to 936 mbar (27.64 inHg), although the winds decreased slightly. Shortly afterwards, the hurricane made landfall near Grand Bahama Island with winds of 130 mph (210 km/h) and a central pressure of 937 mbar (27.67 inHg).
By the evening of October 6, the hurricane had begun to parallel fairly close to the coast of Florida. Throughout the night and into the early morning hours on October 7, the National Hurricane Center consistently reminded the public that "a small deviation of the track to the left of the NHC forecast could bring the core of a major hurricane onshore"; had it done so, it would have been the first to move ashore in the United States since Hurricane Wilma nearly 11 years prior. Subsequently, the hurricane again weakened due to an eyewall replacement cycle. As a result, the hurricane fell below Category 4 intensity early on October 7. By 00:00 UTC on October 8, the storm weakened below major hurricane intensity, a status it had held for nearly eight days since attaining it on September 30 while in the Caribbean.
By late on October 7, as Matthew advanced towards the Carolinas, paralleling the coast of Georgia, the southern eyewall of the hurricane had broken apart, as seen from Doppler radar, subsequently, the associated satellite presentation had started to become elongated. A more rapid weakening phase took place and Matthew weakened to a Category 1 hurricane just before making landfall at the Cape Romain National Wildlife Refuge in South Carolina with sustained winds of 85 mph (135 km/h) and a central pressure of 963 mbar (28.44 inHg) – making it the most intense hurricane (by central pressure) to strike the United States since Hurricane Irene in 2011, until Hurricane Harvey in 2017, and the first hurricane to make landfall in the state of South Carolina since Gaston in 2004. It was also the first hurricane to make landfall north of Florida in October since Hurricane Hazel in 1954.
Unrealised turn south
While the hurricane traversed the Bahamas on October 5, the complex interaction between Matthew, a trough moving off the East Coast, a ridge over New England, and then Tropical Storm Nicole near Bermuda led to unusually high uncertainty in its future track. For several days, meteorologists at the NHC forecast the hurricane to turn south while near the Carolinas and make a loop toward Florida and impact the state a second time. If such an event took place, it would have been the first such occurrence on record of a hurricane striking the east coast of Florida twice. For the loop to have taken place, a trough moving toward the Eastern United States, associated with the jet stream, would have to "miss" Matthew and not cause the hurricane to accelerate out to sea. This, in turn, would have allowed a building ridge over New England to force Matthew back south. Thereafter, interaction with Tropical Storm Nicole (via the Fujiwhara effect) would have further prevented Matthew from turning east away from land.
The GFS model in particular consistently showed this scenario for several days, even taking the remnants of Matthew into the Gulf of Mexico and later Louisiana—a track reminiscent of Hurricane Betsy in 1965. Barry Keim, a climatologist at Louisiana State University, noted a large margin of error with this potential track while forecasters at the NHC declined commentary to keep focus on the immediate landfall threat. Jerry Combs of the Melbourne, Florida, National Weather Service Office reiterated the position of the NHC: "Right now, we're not even worried about [the potential loop]. We need to get through this first round then we can look into the possibilities and what the storm could do."
Dissipation
By the time Matthew had made landfall in South Carolina early on October 8, the cyclone had begun to lose its tropical characteristics as it became embedded into the mid-latitude westerlies. The wind field expanded and became asymmetric, and much of the deepest convection migrated to the north of the center, stretching all the way into parts of the Northeastern United States. As Matthew moved eastwards at about 10 mph (16 km/h), its low-level circulation began to separate from its mid-to-upper circulation due to increasing wind shear. Throughout the night, the structure of Matthew began to resemble more of that of an extratropical cyclone, and by 09:00 UTC on October 9, Matthew became extratropical while located 50 mi (80 km) southeast of Cape Hatteras, North Carolina.
Due to a policy change after Hurricane Sandy in 2012, the National Hurricane Center continued to issue advisories on the extratropical remnants of Matthew, due to tropical-storm force winds still affecting parts of the Carolinas. However, by 21:00 UTC, the agency terminated advisories on the cyclone while located 200 mi (320 km) east of Cape Hatteras. The remnants of the storm persisted for another day before they were absorbed by a cold front south of Canada on October 10.