


Related on Lably
Through Pascal (unit)
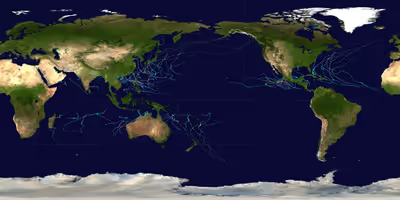
The most active basin in the year was the Western Pacific, which documented 21 named storms. North Atlantic basin documented 19 named storms, continuing the consecutive third-most active season trends from the previous year, due to the 2010–12 La Niña event. Conversely, the Eastern Pacific basin featured slightly more activity than the previous season, with 11 named storms. The least active basin in the year was the North Indian Ocean basin which documented only 2 named storms, the lowest since the 1993 season. Activity across the Southern Hemisphere were almost evenly spread, with the South-West Indian Ocean basin recording 10 tropical cyclones, the Australian region recording 17 tropical cyclones, and the South Pacific basin also recording 10 tropical cyclones, respectively. Twenty-one Category 3 tropical cyclones formed in the year, including three Category 5 tropical cyclones. The accumulated cyclone energy (ACE) index for the 2011 (seven basins combined), as calculated by Colorado State University was 573.8 units.
Tropical cyclones are primarily monitored by a group of ten warning centers, which have been designated as a Regional Specialized Meteorological Centre (RSMC) or a Tropical Cyclone Warning Center (TCWC) by the World Meteorological Organization. These are the United States National Hurricane Center (NHC) and Central Pacific Hurricane Center, the Japan Meteorological Agency (JMA), the Indian Meteorological Department (IMD), Météo-France (MFR), Indonesia's Badan Meteorologi, Klimatologi, dan Geofisika, the Australian Bureau of Meteorology (BOM), Papua New Guinea's National Weather Service, the Fiji Meteorological Service (FMS) as well as New Zealand's MetService. Other notable warning centers include the Philippine Atmospheric, Geophysical, and Astronomical Services Administration (PAGASA), the United States Joint Typhoon Warning Center (JTWC), and the Brazilian Navy Hydrographic Center(BNHC).
Global atmospheric and hydrological conditions
The strong La Niña from the previous year continued into 2011, whereby it peaked in January. Afterwards, it began weakening considerably, to the point where in May it was determined that a transition to neutral conditions took place. By the end of Summer, this neutral state continued to persist, although there were still remnants of the La Niña evident. Due to continued cooling of the Pacific, it was determined that the La Niña redeveloped, albeit in a weak state, which would then continue into the next year.
Sign in to keep reading
3 more chapters are free with a Lably account.
Summary
Systems
January
During January 2011, a total of 12 tropical cyclones, all of them, formed within the southern hemisphere. No tropical cyclone was observed in the northern hemisphere. Of the systems, 7 further intensified to become named. Out of the systems, Wilma was the most intense tropical cyclone, with a minimum barometric pressure of 935 mbar/hPa.
February
10 systems formed and 5 named storms during February.
March
March was a relatively inactive month in which 11 systems formed, and only 3 received names.
April
May
May was a mostly inactive month in which only 4 tropical cyclones formed, in which 2 received names.
June
July
August
August was the most active month of 2011, with 18 systems forming in the month.
September
September was a below-average month, with only 16 tropical cyclones forming in that month.
October
November
November was inactive with only 7 tropical cyclones forming, as well as Rolf, a system that formed in the Mediterranean sea.
December
Global effects
There are a total of seven tropical cyclone basins that tropical cyclones typically form in this table, data from all these basins are added.