

Yield curve
Relationships among bond yields of different maturities
- 20 min read
- 6 chapters

Related on Lably
Through Supply and demand, Corporation and Great Depression
Different markets publish related curves for different purposes. Common examples include government bond curves, overnight indexed swap curves and interest rate swap curves. These families are produced by central banks and data providers from prices of instruments in each market and are kept comparable within a family by construction.
Analysts often summarize the curve's shape with a "term spread" such as the difference between the 10-year Treasury yield and the 3-month Treasury bill rate. Central banks track these measures because a sustained inversion has historically preceded U.S. recessions and is used in simple recession-probability models.
The yield curve is closely related to the term structure of interest rates. Official sources distinguish several ways to summarize it, including zero-coupon or "spot" curves, implied forward curves and par yield curves, each derived from the same underlying prices.
Significance of slope and shape
The slope is often summarised by a term spread. A common choice is the 10-year minus 3-month Treasury rates (the New York Fed's convention). Other pairs, such as 10-year minus 2-year, are also used in practice. A wider spread indicates a steeper slope.
There are two common explanations for upward sloping yield curves. First, it may be that the market is anticipating a rise in the risk-free rate. If investors hold off investing now, they may receive a better rate in the future. Therefore, under the arbitrage pricing theory, investors who are willing to lock their money in now need to be compensated for the anticipated rise in rates—thus the higher interest rate on long-term investments. Another explanation is that longer maturities entail greater risks for the investor (i.e. the lender). A risk premium is needed by the market, since at longer durations there is more uncertainty and a greater chance of events that impact the investment. This explanation depends on the notion that the economy faces more uncertainties in the distant future than in the near term. This effect is referred to as the liquidity spread. If the market expects more volatility in the future, even if interest rates are anticipated to decline, the increase in the risk premium can influence the spread and cause an increasing yield.
The opposite situation can also occur, in which the yield curve is "inverted", with short-term interest rates higher than long-term. For instance, in November 2004, the yield curve for UK Government bonds was partially inverted. The yield for the 10-year bond stood at 4.68%, but was only 4.45% for the 30-year bond. The market's anticipation of falling interest rates causes such incidents. Negative liquidity premiums can also exist if long-term investors dominate the market, but the prevailing view is that a positive liquidity premium dominates, so only the anticipation of falling interest rates will cause an inverted yield curve. Strongly inverted yield curves have historically preceded economic recessions.
The shape of the yield curve is influenced by supply and demand: for instance, if there is a large demand for long bonds, for instance from pension funds to match their fixed liabilities to pensioners, and not enough bonds in existence to meet this demand, then the yields on long bonds can be expected to be low, irrespective of market participants' views about future events.
The yield curve may also be flat or hump-shaped, due to anticipated interest rates being steady, or short-term volatility outweighing long-term volatility.
Yield curves continually move all the time that the markets are open, reflecting the market's reaction to news. A further "stylized fact" is that yield curves tend to move in parallel; i.e.: the yield curve shifts up and down as interest rate levels rise and fall, which is then referred to as a "parallel shift".
Types of yield curve
There is no single yield curve describing the cost of money for everybody. The most important factor in determining a yield curve is the currency in which the securities are denominated. The economic position of the countries and companies using each currency is a primary factor in determining the yield curve. Different institutions borrow money at different rates, depending on their creditworthiness.
The yield curves corresponding to the bonds issued by governments in their own currency are called the government bond yield curve (government curve). Banks and other issuers are quoted on swap curves, which reflect interbank funding and derivatives pricing and are typically above government curves of the same currency. Market participants refer to these as the swap curve. The construction of the swap curve is described below.
Besides the government curve and the LIBOR curve, there are corporate (company) curves. These are constructed from the yields of bonds issued by corporations. Since corporations have less creditworthiness than most governments and most large banks, these yields are typically higher. Corporate yield curves are often quoted in terms of a "credit spread" over the relevant swap curve. For instance the five-year yield curve point for Vodafone might be quoted as LIBOR +0.25%, where 0.25% (often written as 25 basis points or 25bps) is the credit spread.
Normal yield curve
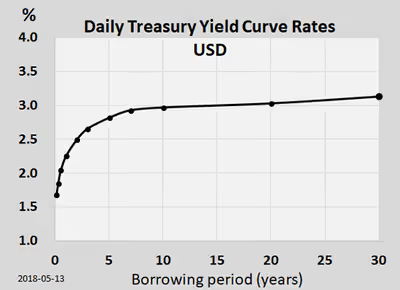
From the post-Great Depression era to the present, the yield curve has usually been "normal" meaning that yields rise as maturity lengthens (i.e., the slope of the yield curve is positive). A positive slope is consistent with expectations of higher future short-term rates and with term premia that compensate for uncertainty about inflation and rates at longer maturities. In a positively sloped curve, as a bond “rolls down” toward shorter maturities its yield typically falls and its price rises, contributing to return if yields are unchanged.
However, a positively sloped yield curve has not always been the norm. Through much of the 19th century and early 20th century the US economy experienced trend growth with persistent deflation, not inflation. During this period the yield curve was typically inverted, reflecting the fact that deflation made current cash flows less valuable than future cash flows (i.e. the purchasing power of $1 would increase over time). During this period of persistent deflation, a 'normal' yield curve was negatively sloped.
Steep yield curve
Historically, the 20-year Treasury bond yield has averaged approximately two percentage points above that of three-month Treasury bills. In situations when this gap increases (e.g. 20-year Treasury yield rises much higher than the three-month Treasury yield), the economy is expected to improve quickly in the future. This type of curve can be seen at the beginning of an economic expansion (or after the end of a recession). Here, economic stagnation will have depressed short-term interest rates; however, rates begin to rise once the demand for capital is re-established by growing economic activity.
In January 2010, the gap between yields on two-year Treasury notes and 10-year notes widened to 2.92 percentage points, its highest ever.
Flat or humped yield curve
A flat yield curve is observed when all maturities have similar yields, whereas a humped curve results when short-term and long-term yields are equal and medium-term yields are higher than those of the short-term and long-term. A flat curve sends signals of uncertainty in the economy. This mixed signal can revert to a normal curve or could later result into an inverted curve. It cannot be explained by the Segmented Market theory discussed below.
Inverted yield curve
Under unusual circumstances, investors will settle for lower yields associated with low-risk long-term debt if they think the economy will enter a recession in the near future. For example, the S&P 500 experienced a dramatic fall in mid 2007, from which it recovered completely by early 2013. Investors who had purchased 10-year Treasuries in 2006 would have received a safe and steady yield until 2015, possibly achieving better returns than those investing in equities during that volatile period.
Economist Campbell Harvey's 1986 dissertation showed that an inverted yield curve accurately forecasts U.S. recessions. An inverted curve has indicated a worsening economic situation in the future eight times since 1970.
In addition to potentially signaling an economic decline, inverted yield curves also imply that the market believes inflation will remain low. This is because, even if there is a recession, a low bond yield will still be offset by low inflation. However, technical factors, such as a flight to quality or global economic or currency situations, may cause an increase in demand for bonds on the long end of the yield curve, causing long-term rates to fall. Falling long-term rates in the presence of rising short-term rates is known as "Greenspan's Conundrum".
Sign in to keep reading
5 more chapters are free with a Lably account.
Relationship to the business cycle
The slope of the yield curve is one of the most powerful predictors of future economic growth, inflation, and recessions. One measure of the yield curve slope (i.e. the difference between 10-year Treasury bond rate and the 3-month Treasury bond rate) is included in the Financial Stress Index published by the St. Louis Fed. A different measure of the slope (i.e. the difference between 10-year Treasury bond rates and the federal funds rate) is incorporated into the Index of Leading Economic Indicators published by The Conference Board.
An inverted yield curve is often a harbinger of recession. A positively sloped yield curve is often a harbinger of inflationary growth. Work by Arturo Estrella and Tobias Adrian has established the predictive power of an inverted yield curve to signal a recession. Their models show that when the difference between short-term interest rates (they use 3-month T-bills) and long-term interest rates (10-year Treasury bonds) at the end of a federal reserve tightening cycle is negative or less than 93 basis points positive, a rise in unemployment usually occurs. The New York Fed publishes a monthly recession probability prediction derived from the yield curve and based on Estrella's work.
All the recessions in the US since 1970 have been preceded by an inverted yield curve (10-year vs 3-month). Over the same time frame, every occurrence of an inverted yield curve has been followed by recession as declared by the NBER business cycle dating committee. The yield curve became inverted in the first half of 2019, for the first time since 2007.
Estrella and others have postulated that the yield curve affects the business cycle via the balance sheet of banks (or bank-like financial institutions). When the yield curve is inverted, banks are often caught paying more on short-term deposits (or other forms of short-term wholesale funding) than they are making on new long-term loans leading to a loss of profitability and reluctance to lend resulting in a credit crunch. When the yield curve is upward sloping, banks can profitably take-in short-term deposits and make new long-term loans so they are eager to supply credit to borrowers. This eventually leads to a credit bubble.
Theory
There are three main economic theories attempting to explain how yields vary with maturity. Two of the theories are extreme positions, while the third attempts to find a middle ground between the former two.
Market expectations (pure expectations) hypothesis
This hypothesis assumes that the various maturities are perfect substitutes and suggests that the shape of the yield curve depends on market participants' expectations of future interest rates. It assumes that market forces will cause the interest rates on various terms of bonds to be such that the expected final value of a sequence of short-term investments will equal the known final value of a single long-term investment. If this did not hold, the theory assumes that investors would quickly demand more of the current short-term or long-term bonds (whichever gives the higher expected long-term yield), and this would drive down the return on current bonds of that term and drive up the yield on current bonds of the other term, so as to quickly make the assumed equality of expected returns of the two investment approaches hold.
Using this, futures rates, along with the assumption that arbitrage opportunities will be minimal in future markets, and that futures rates are unbiased estimates of forthcoming spot rates, provide enough information to construct a complete expected yield curve. For example, if investors have an expectation of what 1-year interest rates will be next year, the current 2-year interest rate can be calculated as the compounding of this year's 1-year interest rate by next year's expected 1-year interest rate. More generally, returns (1+ yield) on a long-term instrument are assumed to equal the geometric mean of the expected returns on a series of short-term instruments:
where ist and ilt are the expected short-term and actual long-term interest rates (but is the actual observed short-term rate for the first year).
This theory is consistent with the observation that yields usually move together. However, it fails to explain the persistence in the shape of the yield curve.
Shortcomings of expectations theory include that it neglects the interest rate risk inherent in investing in bonds.
Liquidity premium theory
The liquidity premium theory is an offshoot of the pure expectations theory. The liquidity premium theory asserts that long-term interest rates not only reflect investors' assumptions about future interest rates but also include a premium for holding long-term bonds (investors prefer short-term bonds to long-term bonds), called the term premium or the liquidity premium. This premium compensates investors for the added risk of having their money tied up for a longer period, including the greater price uncertainty. Because of the term premium, long-term bond yields tend to be higher than short-term yields and the yield curve slopes upward. Long-term yields are also higher not just because of the liquidity premium, but also because of the risk premium added by the risk of default from holding a security over the long term. The market expectations hypothesis is combined with the liquidity premium theory:
where is the risk premium associated with an year bond.
Preferred habitat theory
The preferred habitat theory is a variant of the liquidity premium theory, and states that in addition to interest rate expectations, investors have distinct investment horizons and require a meaningful premium to buy bonds with maturities outside their "preferred" maturity, or habitat. Proponents of this theory believe that short-term investors are more prevalent in the fixed-income market, and therefore longer-term rates tend to be higher than short-term rates, for the most part, but short-term rates can be higher than long-term rates occasionally. This theory is consistent with both the persistence of the normal yield curve shape and the tendency of the yield curve to shift up and down while retaining its shape.
Market segmentation theory
This theory is also called the segmented market hypothesis. In this theory, financial instruments of different terms are not substitutable. As a result, the supply and demand in the markets for short-term and long-term instruments is determined largely independently. Prospective investors decide in advance whether they need short-term or long-term instruments. If investors prefer their portfolio to be liquid, they will prefer short-term instruments to long-term instruments. Therefore, the market for short-term instruments will receive a higher demand. Higher demand for the instrument implies higher prices and lower yield. This explains the stylized fact that short-term yields are usually lower than long-term yields. This theory explains the predominance of the normal yield curve shape. However, because the supply and demand of the two markets are independent, this theory fails to explain the observed fact that yields tend to move together (i.e., upward and downward shifts in the curve).
Historical development of yield curve theory
On August 15, 1971, U.S. President Richard Nixon announced that the U.S. dollar would no longer be based on the gold standard, thereby ending the Bretton Woods system and initiating the era of floating exchange rates.
Floating exchange rates made life more complicated for bond traders, including those at Salomon Brothers in New York City. Encouraged by Marty Liebowitz, traders began thinking about bond yields in new ways by the middle of the 1970s. Rather than think of each maturity (a ten-year bond, a five-year, etc.) as a separate marketplace, they began drawing a curve through all their yields. The bit nearest the present time became known as the short end—yields of bonds further out became, naturally, the long end.
Academics had to play catch up with practitioners in this matter. One important theoretic development came from a Czech mathematician, Oldrich Vasicek, who argued in a 1977 paper that bond prices all along the curve are driven by the short end (under risk-neutral equivalent martingale measure) and accordingly by short-term interest rates. The mathematical model for Vasicek's work was given by an Ornstein–Uhlenbeck process, but has since been discredited because the model predicts a positive probability that the short rate becomes negative and is inflexible in creating yield curves of different shapes. Vasicek's model has been superseded by many different models including the Hull–White model (which allows for time varying parameters in the Ornstein–Uhlenbeck process), the Cox–Ingersoll–Ross model, which is a modified Bessel process, and the Heath–Jarrow–Morton framework. There are also many modifications to each of these models, but see the article on short-rate model. Another modern approach is the LIBOR market model, introduced by Brace, Gatarek and Musiela in 1997 and advanced by others later. In 1996, a group of derivatives traders led by Olivier Doria (then head of swaps at Deutsche Bank) and Michele Faissola, contributed to an extension of the swap yield curves in all the major European currencies. Until then the market would give prices until 15 years maturities. The team extended the maturity of European yield curves up to 50 years (for the lira, French franc, Deutsche mark, Danish krone and many other currencies including the ecu). This innovation was a major contribution towards the issuance of long dated zero-coupon bonds and the creation of long dated mortgages.
Construction of the full yield curve from market data
The usual representation of the yield curve is in terms of a function P, defined on all future times t, such that P(t) represents the value today of receiving one unit of currency t years in the future. If P is defined for all future t then - by "bootstrapping" - we can easily recover the yield (i.e. the annualized interest rate) for borrowing money for that period of time via the formula
The significant difficulty in defining a yield curve therefore is to determine the function P(t). P is called the discount factor function or the zero coupon bond.
Yield curves are built from either prices available in the bond market or the money market. Whilst the yield curves built from the bond market use prices only from a specific class of bonds (for instance bonds issued by the UK government) yield curves built from the money market use prices of "cash" from today's LIBOR rates, which determine the "short end" of the curve i.e. for t ≤ 3m, interest rate futures which determine the midsection of the curve (3m ≤ t ≤ 15m) and interest rate swaps which determine the "long end" (1y ≤ t ≤ 60y).
The example given in the table at the right is known as a LIBOR curve because it is constructed using either LIBOR rates or swap rates. A LIBOR curve is the most widely used interest rate curve as it represents the credit worth of private entities at about A+ rating, roughly the equivalent of commercial banks. If one substitutes the LIBOR and swap rates with government bond yields, one arrives at what is known as a government curve, usually considered the risk free interest rate curve for the underlying currency. The spread between the LIBOR (or swap) rate and the government bond yield of similar maturity is usually positive, meaning that private borrowing is at a premium above government borrowing. This spread is a measure of the difference in the risk tolerances of the lenders to the two types of borrowing. For the U. S. market, a common benchmark for such a spread is given by the so-called TED spread.
In either case the available market data provides a matrix A of cash flows, each row representing a particular financial instrument and each column representing a point in time. The (i,j)-th element of the matrix represents the amount that instrument i will pay out on day j. Let the vector F represent today's prices of the instrument (so that the i-th instrument has value F(i)), then by definition of our discount factor function P we should have that F = AP (this is a matrix multiplication). Actually, noise in the financial markets means it is not possible to find a P that solves this equation exactly, and our goal becomes to find a vector P such that
where is as small a vector as possible (where the size of a vector might be measured by taking its norm, for example).
Even if we can solve this equation, we will only have determined P(t) for those t which have a cash flow from one or more of the original instruments we are creating the curve from. Values for other t are typically determined using some sort of interpolation scheme.
Practitioners and researchers have suggested many ways of solving the A*P = F equation. It transpires that the most natural method – that of minimizing by least squares regression – leads to unsatisfactory results. The large number of zeroes in the matrix A mean that function P turns out to be "bumpy".
In their comprehensive book on interest rate modelling James and Webber note that the following techniques have been suggested to solve the problem of finding P:
- Approximation using Lagrange polynomials
- Fitting using parameterised curves (such as splines, the Nelson-Siegel family, the Svensson family, the exponential polynomial family or the Cairns restricted-exponential family of curves). Van Deventer, Imai and Mesler summarize three different techniques for curve fitting that satisfy the maximum smoothness of either forward interest rates, zero coupon bond prices, or zero coupon bond yields
- Local regression using kernels
- Linear programming
In the money market practitioners might use different techniques to solve for different areas of the curve. For example, at the short end of the curve, where there are few cashflows, the first few elements of P may be found by bootstrapping from one to the next. At the long end, a regression technique with a cost function that values smoothness might be used.
The yield curve as parametric model: Nelson–Siegel–Svensson model
While bootstrapping provides an exact, non-parametric extraction of the yield curve, it can result in an unstable or jagged forward curve. To achieve a smoother, more economically intuitive term structure, analysts turn to parametric models. The Nelson–Siegel–Svensson (NSS) model is a widely used framework for fitting and interpolating yield curves from observed bond prices or rates. It extends the three-factor model of Nelson and Siegel (1987), which describes the yield curve using three components — level, slope, and curvature — each governed by an exponential decay term.
Svensson (1994) introduced a fourth factor and a second decay parameter, giving the model greater flexibility to capture humps or troughs at different maturities:
where is maturity, controls the long-run level, the short-end slope, and medium-term curvature components, and , the decay speeds of those components.
The NSS model is used operationally by several major central banks — including the European Central Bank, the Deutsche Bundesbank, and the Swiss National Bank — to publish official fitted yield curves. Its parameters admit direct economic interpretation: represents the long-run yield to which the curve converges, while captures the term spread between short and long rates. Diebold and Li (2006) demonstrated that re-labelling the Nelson–Siegel factors as level, slope, and curvature and treating them as latent dynamic factors yields strong out-of-sample forecasting performance.
Because estimation requires non-linear optimisation over six parameters, convergence is sensitive to initial values; the Bank for International Settlements has published a technical note addressing common pitfalls. Interactive tools that allow users to vary the NSS parameters and observe the resulting curve shape in real time have been developed to aid intuition.
Effect on bond prices
There is a time dimension to the analysis of bond values. A 10-year bond at purchase becomes a 9-year bond a year later, and the year after it becomes an 8-year bond, etc. Each year the bond moves incrementally closer to maturity, resulting in lower volatility and shorter duration and demanding a lower interest rate when the yield curve is rising. Since falling rates create increasing prices, the value of a bond initially will rise as the lower rates of the shorter maturity become its new market rate. Because a bond is always anchored by its final maturity, the price at some point must change direction and fall to par value at redemption.
A bond's market value at different times in its life can be calculated. When the yield curve is steep, the bond is predicted to have a large capital gain in the first years before falling in price later. When the yield curve is flat, the capital gain is predicted to be much less, and there is little variability in the bond's total returns over time.
As market rates of interest increase or decrease, the impact is rarely the same at each point along the yield curve, i.e. the curve rarely moves up or down in parallel. Because longer-term bonds have a larger duration, a rise in rates will cause a larger capital loss for them, than for short-term bonds. But almost always, the long maturity's rate will change much less, flattening the yield curve. The greater change in rates at the short end will offset to some extent the advantage provided by the shorter bond's lower duration.
Long duration bonds tend to be mean reverting, meaning that they readily gravitate to a long-run average. The middle of the curve (5–10 years) will see the greatest percentage gain in yields if there is anticipated inflation even if interest rates have not changed. The long-end does not move quite as much percentage-wise because of the mean reverting properties.
The yearly 'total return' from the bond is a) the sum of the coupon's yield plus b) the capital gain from the changing valuation as it slides down the yield curve and c) any capital gain or loss from changing interest rates at that point in the yield curve.