

Food web
Natural interconnection of food chains
- 21 min read
- 5 chapters
- 4 labs on Lably

Learn it on Lably
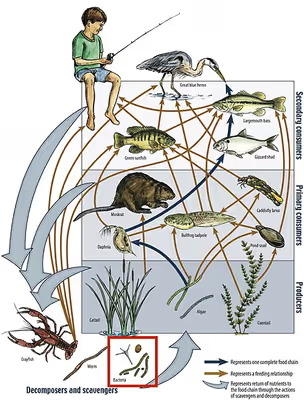
The linkages in a food web illustrate the feeding pathways, such as where heterotrophs obtain organic matter by feeding on autotrophs and other heterotrophs. The food web is a simplified illustration of the various methods of feeding that link an ecosystem into a unified system of exchange. There are different kinds of consumer–resource interactions that can be roughly divided into herbivory, carnivory, scavenging, and parasitism. Some of the organic matter eaten by heterotrophs, such as sugars, provides energy. Autotrophs and heterotrophs come in all sizes, from microscopic to many tonnes - from cyanobacteria to giant redwoods, and from viruses and bdellovibrio to blue whales.
Charles Elton pioneered the concept of food cycles, food chains, and food size in his classical 1927 book "Animal Ecology"; Elton's 'food cycle' was replaced by 'food web' in a subsequent ecological text. Elton organized species into functional groups, which was the basis for Raymond Lindeman's classic and landmark paper in 1942 on trophic dynamics. Lindeman emphasized the important role of decomposer organisms in a trophic system of classification. The notion of a food web has a historical foothold in the writings of Charles Darwin and his terminology, including an "entangled bank", "web of life", "web of complex relations", and in reference to the decomposition actions of earthworms he talked about "the continued movement of the particles of earth". Even earlier, in 1768 John Bruckner described nature as "one continued web of life".
Food webs are limited representations of real ecosystems as they necessarily aggregate many species into trophic species, which are functional groups of species that have the same predators and prey in a food web. Ecologists use these simplifications in quantitative (or mathematical representation) models of trophic or consumer-resource systems dynamics. Using these models they can measure and test for generalized patterns in the structure of real food web networks. Ecologists have identified non-random properties in the topological structure of food webs. Published examples that are used in meta analysis are of variable quality with omissions. However, the number of empirical studies on community webs is on the rise and the mathematical treatment of food webs using network theory had identified patterns that are common to all. Scaling laws, for example, predict a relationship between the topology of food web predator-prey linkages and levels of species richness.
Taxonomy of a food web
Links in food webs map the feeding connections (who eats whom) in an ecological community. Food cycle is an obsolete term that is synonymous with food web. Ecologists can broadly group all life forms into one of two trophic layers, the autotrophs and the heterotrophs. Autotrophs produce more biomass energy, either chemically without the sun's energy or by capturing the sun's energy in photosynthesis, than they use during metabolic respiration. Heterotrophs consume rather than produce biomass energy as they metabolize, grow, and add to levels of secondary production. A food web depicts a collection of polyphagous heterotrophic consumers that network and cycle the flow of energy and nutrients from a productive base of self-feeding autotrophs.
The base or basal species in a food web are those species without prey and can include autotrophs or saprophytic detritivores (i.e., the community of decomposers in soil, biofilms, and periphyton). Feeding connections in the web are called trophic links. The number of trophic links per consumer is a measure of food web connectance. Food chains are nested within the trophic links of food webs. Food chains are linear (noncyclic) feeding pathways that trace monophagous consumers from a base species up to the top consumer, which is usually a larger predatory carnivore.
Linkages connect to nodes in a food web, which are aggregates of biological taxa called trophic species. Trophic species are functional groups that have the same predators and prey in a food web. Common examples of an aggregated node in a food web might include parasites, microbes, decomposers, saprotrophs, consumers, or predators, each containing many species in a web that can otherwise be connected to other trophic species.
Trophic levels
Food webs have trophic levels and positions. Basal species, such as plants, form the first level and are the resource-limited species that feed on no other living creature in the web. Basal species can be autotrophs or detritivores, including "decomposing organic material and its associated microorganisms which we defined as detritus, micro-inorganic material and associated microorganisms (MIP), and vascular plant material." Most autotrophs capture the sun's energy in chlorophyll, but some autotrophs (the chemolithotrophs) obtain energy by the chemical oxidation of inorganic compounds and can grow in dark environments, such as the sulfur bacterium Thiobacillus, which lives in hot sulfur springs. The top level has top (or apex) predators that no other species kills directly for their food resource needs. The intermediate levels are filled with omnivores that feed on more than one trophic level and cause energy to flow through several food pathways starting from a basal species.
In the simplest scheme, the first trophic level (level 1) is plants, then herbivores (level 2), and then carnivores (level 3). The trophic level equals one more than the chain length, which is the number of links connecting to the base. The base of the food chain (primary producers or detritivores) is set at zero. Ecologists identify feeding relations and organize species into trophic species through extensive gut content analysis of different species. The technique has been improved through the use of stable isotopes to better trace energy flow through the web. It was once thought that omnivory was rare, but recent evidence suggests otherwise. This realization has made trophic classifications more complex.
Like many wetlands, some ecosystems do not organize as a strict pyramid because aquatic plants are less productive than long-lived terrestrial plants such as trees. Ecological trophic pyramids are typically one of three kinds: 1) pyramid of numbers, 2) pyramid of biomass, or 3) pyramid of energy.
Trophic dynamics and multitrophic interactions
The trophic level concept was introduced in a historical landmark paper on trophic dynamics in 1942 by Raymond L. Lindeman. The basis of trophic dynamics is the transfer of energy from one part of the ecosystem to another. The trophic dynamic concept has served as a useful quantitative heuristic, but it has several major limitations including the precision by which an organism can be allocated to a specific trophic level. Omnivores, for example, are not restricted to any single level. Nonetheless, recent research has found that discrete trophic levels do exist, but "above the herbivore trophic level, food webs are better characterized as a tangled web of omnivores."
A central question in the trophic dynamic literature is the nature of control and regulation over resources and production. Ecologists use simplified one trophic position food chain models (producer, carnivore, decomposer). Using these models, ecologists have tested various types of ecological control mechanisms. For example, herbivores generally have an abundance of vegetative resources, which meant that their populations were largely controlled or regulated by predators. This is known as the top-down hypothesis or 'green-world' hypothesis. Alternatively to the top-down hypothesis, not all plant material is edible and the nutritional quality or antiherbivore defenses of plants (structural and chemical) suggests a bottom-up form of regulation or control. Recent studies have concluded that both "top-down" and "bottom-up" forces can influence community structure and the strength of the influence is environmentally context dependent. These complex multitrophic interactions involve more than two trophic levels in a food web. For example, such interactions have been discovered in the context of arbuscular mycorrhizal fungi and aphid herbivores that utilize the same plant species.
Another example of a multitrophic interaction is a trophic cascade, in which predators help to increase plant growth and prevent overgrazing by suppressing herbivores. Links in a food-web illustrate direct trophic relations among species, but there are also indirect effects that can alter the abundance, distribution, or biomass in the trophic levels. For example, predators eating herbivores indirectly influence the control and regulation of primary production in plants. Although the predators do not eat the plants directly, they regulate the population of herbivores that are directly linked to plant trophism. The net effect of direct and indirect relations is called trophic cascades. Trophic cascades are separated into species-level cascades, where only a subset of the food-web dynamic is impacted by a change in population numbers, and community-level cascades, where a change in population numbers has a dramatic effect on the entire food-web, such as the distribution of plant biomass.
The field of chemical ecology has elucidated multitrophic interactions that entail the transfer of defensive compounds across multiple trophic levels. For example, certain plant species in the Castilleja and Plantago genera have been found to produce defensive compounds called iridoid glycosides that are sequestered in the tissues of the Taylor's checkerspot butterfly larvae that have developed a tolerance for these compounds and are able to consume the foliage of these plants. These sequestered iridoid glycosides then confer chemical protection against bird predators to the butterfly larvae. Another example of this sort of multitrophic interaction in plants is the transfer of defensive alkaloids produced by endophytes living within a grass host to a hemiparasitic plant that is also using the grass as a host.
Energy flow and biomass
Food webs depict energy flow via trophic linkages. Energy flow is directional, which contrasts against the cyclic flows of material through the food web systems. Energy flow "typically includes production, consumption, assimilation, non-assimilation losses (feces), and respiration (maintenance costs)." In a very general sense, energy flow (E) can be defined as the sum of metabolic production (P) and respiration (R), such that E=P+R.
Biomass represents stored energy. However, concentration and quality of nutrients and energy is variable. Many plant fibers, for example, are indigestible to many herbivores leaving grazer community food webs more nutrient limited than detrital food webs where bacteria are able to access and release the nutrient and energy stores. "Organisms usually extract energy in the form of carbohydrates, lipids, and proteins. These polymers have a dual role as supplies of energy as well as building blocks; the part that functions as energy supply results in the production of nutrients (and carbon dioxide, water, and heat). Excretion of nutrients is, therefore, basic to metabolism." The units in energy flow webs are typically a measure mass or energy per m2 per unit time. Different consumers are going to have different metabolic assimilation efficiencies in their diets. Each trophic level transforms energy into biomass. Energy flow diagrams illustrate the rates and efficiency of transfer from one trophic level into another and up through the hierarchy.
It is the case that the biomass of each trophic level decreases from the base of the chain to the top. This is because energy is lost to the environment with each transfer as entropy increases. About eighty to ninety percent of the energy is expended for the organism's life processes or is lost as heat or waste. Only about ten to twenty percent of the organism's energy is generally passed to the next organism. The amount can be less than one percent in animals consuming less digestible plants, and it can be as high as forty percent in zooplankton consuming phytoplankton. Graphic representations of the biomass or productivity at each tropic level are called ecological pyramids or trophic pyramids. The transfer of energy from primary producers to top consumers can also be characterized by energy flow diagrams.
Food chain
A common metric used to quantify food web trophic structure is food chain length. Food chain length is another way of describing food webs as a measure of the number of species encountered as energy or nutrients move from the plants to top predators. There are different ways of calculating food chain length depending on what parameters of the food web dynamic are being considered: connectance, energy, or interaction. In its simplest form, the length of a chain is the number of links between a trophic consumer and the base of the web. The mean chain length of an entire web is the arithmetic average of the lengths of all chains in a food web.
In a simple predator-prey example, a deer is one step removed from the plants it eats (chain length = 1) and a wolf that eats the deer is two steps removed from the plants (chain length = 2). The relative amount or strength of influence that these parameters have on the food web address questions about:
- the identity or existence of a few dominant species (called strong interactors or keystone species)
- the total number of species and food-chain length (including many weak interactors) and
- how community structure, function and stability is determined.
Ecological pyramids
In a pyramid of numbers, the number of consumers at each level decreases significantly, so that a single top consumer, (e.g., a polar bear or a human), will be supported by a much larger number of separate producers. There is usually a maximum of four or five links in a food chain, although food chains in aquatic ecosystems are more often longer than those on land. Eventually, all the energy in a food chain is dispersed as heat.
Ecological pyramids place the primary producers at the base. They can depict different numerical properties of ecosystems, including numbers of individuals per unit of area, biomass (g/m2), and energy (k cal m−2 yr−1). The emergent pyramidal arrangement of trophic levels with amounts of energy transfer decreasing as species become further removed from the source of production is one of several patterns that is repeated amongst the planets ecosystems. The size of each level in the pyramid generally represents biomass, which can be measured as the dry weight of an organism. Autotrophs may have the highest global proportion of biomass, but they are closely rivaled or surpassed by microbes.
Pyramid structure can vary across ecosystems and across time. In some instances biomass pyramids can be inverted. This pattern is often identified in aquatic and coral reef ecosystems. The pattern of biomass inversion is attributed to different sizes of producers. Aquatic communities are often dominated by producers that are smaller than the consumers that have high growth rates. Aquatic producers, such as planktonic algae or aquatic plants, lack the large accumulation of secondary growth as exists in the woody trees of terrestrial ecosystems. However, they are able to reproduce quickly enough to support a larger biomass of grazers. This inverts the pyramid. Primary consumers have longer lifespans and slower growth rates that accumulates more biomass than the producers they consume. Phytoplankton live just a few days, whereas the zooplankton eating the phytoplankton live for several weeks and the fish eating the zooplankton live for several consecutive years. Aquatic predators also tend to have a lower death rate than the smaller consumers, which contributes to the inverted pyramidal pattern. Population structure, migration rates, and environmental refuge for prey are other possible causes for pyramids with biomass inverted. Energy pyramids, however, will always have an upright pyramid shape if all sources of food energy are included and this is dictated by the second law of thermodynamics.
Sign in to keep reading
4 more chapters are free with a Lably account.
Material flux and recycling
Many of the Earth's elements and minerals (or mineral nutrients) are contained within the tissues and diets of organisms. Hence, mineral and nutrient cycles trace food web energy pathways. Ecologists employ stoichiometry to analyze the ratios of the main elements found in all organisms: carbon (C), nitrogen (N), phosphorus (P). There is a large transitional difference between many terrestrial and aquatic systems as C:P and C:N ratios are much higher in terrestrial systems while N:P ratios are equal between the two systems. Mineral nutrients are the material resources that organisms need for growth, development, and vitality. Food webs depict the pathways of mineral nutrient cycling as they flow through organisms. Most of the primary production in an ecosystem is not consumed, but is recycled by detritus back into useful nutrients. Many of the Earth's microorganisms are involved in the formation of minerals in a process called biomineralization. Bacteria that live in detrital sediments create and cycle nutrients and biominerals. Food web models and nutrient cycles have traditionally been treated separately, but there is a strong functional connection between the two in terms of stability, flux, sources, sinks, and recycling of mineral nutrients.
Kinds of food webs
Food webs are necessarily aggregated and only illustrate a tiny portion of the complexity of real ecosystems. For example, the number of species on the planet are likely in the general order of 107, over 95% of these species consist of microbes and invertebrates, and relatively few have been named or classified by taxonomists. It is explicitly understood that natural systems are 'sloppy' and that food web trophic positions simplify the complexity of real systems that sometimes overemphasize many rare interactions. Most studies focus on the larger influences where the bulk of energy transfer occurs. "These omissions and problems are causes for concern, but on present evidence do not present insurmountable difficulties."
There are different kinds or categories of food webs:
- Source web - one or more node(s), all of their predators, all the food these predators eat, and so on.
- Sink web - one or more node(s), all of their prey, all the food that these prey eat, and so on.
- Community (or connectedness) web - a group of nodes and all the connections of who eats whom.
- Energy flow web - quantified fluxes of energy between nodes along links between a resource and a consumer.
- Paleoecological web - a web that reconstructs ecosystems from the fossil record.
- Functional web - emphasizes the functional significance of certain connections having strong interaction strength and greater bearing on community organization, more so than energy flow pathways. Functional webs have compartments, which are sub-groups in the larger network where there are different densities and strengths of interaction. Functional webs emphasize that "the importance of each population in maintaining the integrity of a community is reflected in its influence on the growth rates of other populations."
Within these categories, food webs can be further organized according to the different kinds of ecosystems being investigated. For example, human food webs, agricultural food webs, detrital food webs, marine food webs, aquatic food webs, soil food webs, Arctic (or polar) food webs, terrestrial food webs, and microbial food webs. These characterizations stem from the ecosystem concept, which assumes that the phenomena under investigation (interactions and feedback loops) are sufficient to explain patterns within boundaries, such as the edge of a forest, an island, a shoreline, or some other pronounced physical characteristic.
Detrital web
In a detrital web, plant and animal matter is broken down by decomposers, e.g., bacteria and fungi, and moves to detritivores and then carnivores. There are often relationships between the detrital web and the grazing web. Mushrooms produced by decomposers in the detrital web become a food source for deer, squirrels, and mice in the grazing web. Earthworms eaten by robins are detritivores consuming decaying leaves.
"Detritus can be broadly defined as any form of non-living organic matter, including different types of plant tissue (e.g. leaf litter, dead wood, aquatic macrophytes, algae), animal tissue (carrion), dead microbes, faeces (manure, dung, faecal pellets, guano, frass), as well as products secreted, excreted or exuded from organisms (e.g. extra-cellular polymers, nectar, root exudates and leachates, dissolved organic matter, extra-cellular matrix, mucilage). The relative importance of these forms of detritus, in terms of origin, size and chemical composition, varies across ecosystems."
Quantitative food webs
Ecologists collect data on trophic levels and food webs to statistically model and mathematically calculate parameters, such as those used in other kinds of network analysis (e.g., graph theory), to study emergent patterns and properties shared among ecosystems. There are different ecological dimensions that can be mapped to create more complicated food webs, including: species composition (type of species), richness (number of species), biomass (the dry weight of plants and animals), productivity (rates of conversion of energy and nutrients into growth), and stability (food webs over time). A food web diagram illustrating species composition shows how change in a single species can directly and indirectly influence many others. Microcosm studies are used to simplify food web research into semi-isolated units such as small springs, decaying logs, and laboratory experiments using organisms that reproduce quickly, such as daphnia feeding on algae grown under controlled environments in jars of water.
While the complexity of real food webs connections are difficult to decipher, ecologists have found mathematical models on networks an invaluable tool for gaining insight into the structure, stability, and laws of food web behaviours relative to observable outcomes. "Food web theory centers around the idea of connectance." Quantitative formulas simplify the complexity of food web structure. The number of trophic links (tL), for example, is converted into a connectance value:
- ,
where, S(S-1)/2 is the maximum number of binary connections among S species. "Connectance (C) is the fraction of all possible links that are realized (L/S2) and represents a standard measure of food web complexity..." The distance (d) between every species pair in a web is averaged to compute the mean distance between all nodes in a web (D) and multiplied by the total number of links (L) to obtain link-density (LD), which is influenced by scale-dependent variables such as species richness. These formulas are the basis for comparing and investigating the nature of non-random patterns in the structure of food web networks among many different types of ecosystems.
Scaling laws, complexity, chaos, and pattern correlates are common features attributed to food web structure.
Complexity and stability
Food webs are extremely complex. Complexity is a term that conveys the mental intractability of understanding all possible higher-order effects in a food web. Sometimes in food web terminology, complexity is defined as product of the number of species and connectance., though there have been criticisms of this definition and other proposed methods for measuring network complexity. Connectance is "the fraction of all possible links that are realized in a network". These concepts were derived and stimulated through the suggestion that complexity leads to stability in food webs, such as increasing the number of trophic levels in more species rich ecosystems. This hypothesis was challenged through mathematical models suggesting otherwise, but subsequent studies have shown that the premise holds in real systems.
At different levels in the hierarchy of life, such as the stability of a food web, "the same overall structure is maintained in spite of an ongoing flow and change of components." The farther a living system (e.g., ecosystem) sways from equilibrium, the greater its complexity. Complexity has multiple meanings in the life sciences and in the public sphere that confuse its application as a precise term for analytical purposes in science. Complexity in the life sciences (or biocomplexity) is defined by the "properties emerging from the interplay of behavioral, biological, physical, and social interactions that affect, sustain, or are modified by living organisms, including humans".
Several concepts have emerged from the study of complexity in food webs. Complexity explains many principals pertaining to self-organization, non-linearity, interaction, cybernetic feedback, discontinuity, emergence, and stability in food webs. Nestedness, for example, is defined as "a pattern of interaction in which specialists interact with species that form perfect subsets of the species with which generalists interact", "—that is, the diet of the most specialized species is a subset of the diet of the next more generalized species, and its diet a subset of the next more generalized, and so on." Until recently, it was thought that food webs had little nested structure, but empirical evidence shows that many published webs have nested subwebs in their assembly.
Food webs are complex networks. As networks, they exhibit similar structural properties and mathematical laws that have been used to describe other complex systems, such as small world and scale free properties. The small world attribute refers to the many loosely connected nodes, non-random dense clustering of a few nodes (i.e., trophic or keystone species in ecology), and small path length compared to a regular lattice. "Ecological networks, especially mutualistic networks, are generally very heterogeneous, consisting of areas with sparse links among species and distinct areas of tightly linked species. These regions of high link density are often referred to as cliques, hubs, compartments, cohesive sub-groups, or modules...Within food webs, especially in aquatic systems, nestedness appears to be related to body size because the diets of smaller predators tend to be nested subsets of those of larger predators (Woodward & Warren 2007; YvonDurocher et al. 2008), and phylogenetic constraints, whereby related taxa are nested based on their common evolutionary history, are also evident (Cattin et al. 2004)." "Compartments in food webs are subgroups of taxa in which many strong interactions occur within the subgroups and few weak interactions occur between the subgroups. Theoretically, compartments increase the stability in networks, such as food webs."
Food webs are also complex in the way that they change in scale, seasonally, and geographically. The components of food webs, including organisms and mineral nutrients, cross the thresholds of ecosystem boundaries. This has led to the concept or area of study known as cross-boundary subsidy. "This leads to anomalies, such as food web calculations determining that an ecosystem can support one half of a top carnivore, without specifying which end." Nonetheless, real differences in structure and function have been identified when comparing different kinds of ecological food webs, such as terrestrial vs. aquatic food webs.
History of food webs
Food webs serve as a framework to help ecologists organize the complex network of interactions among species observed in nature and around the world. One of the earliest descriptions of a food chain was described by a medieval Afro-Arab scholar named Al-Jahiz: "All animals, in short, cannot exist without food, neither can the hunting animal escape being hunted in his turn." The earliest graphical depiction of a food web was by Lorenzo Camerano in 1880, followed independently by those of Pierce and colleagues in 1912 and Victor Shelford in 1913. Two food webs about herring were produced by Victor Summerhayes and Charles Elton and Alister Hardy in 1923 and 1924. Charles Elton subsequently pioneered the concept of food cycles, food chains, and food size in his classical 1927 book "Animal Ecology"; Elton's 'food cycle' was replaced by 'food web' in a subsequent ecological text. After Charles Elton's use of food webs in his 1927 synthesis, they became a central concept in the field of ecology. Elton organized species into functional groups, which formed the basis for the trophic system of classification in Raymond Lindeman's classic and landmark paper in 1942 on trophic dynamics. The notion of a food web has a historical foothold in the writings of Charles Darwin and his terminology, including an "entangled bank", "web of life", "web of complex relations", and in reference to the decomposition actions of earthworms he talked about "the continued movement of the particles of earth". Even earlier, in 1768 John Bruckner described nature as "one continued web of life".
Interest in food webs increased after Robert Paine's experimental and descriptive study of intertidal shores suggesting that food web complexity was key to maintaining species diversity and ecological stability. Many theoretical ecologists, including Sir Robert May and Stuart Pimm, were prompted by this discovery and others to examine the mathematical properties of food webs.