

Functional magnetic resonance imaging
MRI procedure that measures brain activity by detecting associated changes in blood flow
- 49 min read
- 12 chapters

Related on Lably
Through Neuron, Brain and Spinal cord
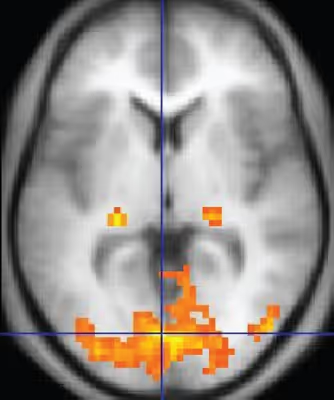
The primary form of fMRI uses the blood-oxygen-level dependent (BOLD) contrast, discovered by Seiji Ogawa and his colleagues in 1990. This is a type of specialized brain and body scan used to map neural activity in the brain or spinal cord of humans or other animals by imaging the change in blood flow (hemodynamic response) related to energy use by nerve cells. Since the early 1990s, fMRI has come to dominate brain mapping research because it is noninvasive, typically requiring no injections, surgery, or the ingestion of substances such as radioactive tracers as in positron emission tomography. Data acquired using fMRI, however, is frequently corrupted by noise from various sources; hence, statistical procedures are used to extract the underlying signal. The resulting brain activation can be graphically represented by color-coding the strength of activation across the brain or the specific region studied. The technique can localize activity to within millimeters but, using standard techniques, no better than within a window of a few seconds. Other methods of obtaining contrast are arterial spin labeling and diffusion MRI. Diffusion MRI is similar to BOLD fMRI but provides contrast based on the magnitude of diffusion of water molecules in the brain.
In addition to detecting BOLD responses from activity due to tasks or stimuli, fMRI can measure resting state, or negative-task state, which shows the subjects' baseline BOLD variance. Since about 1998 studies have shown the existence and properties of the default mode network, a functionally connected neural network of apparent resting brain states.
fMRI is used in research, and to a lesser extent, in clinical work. It can complement other measures of brain physiology such as electroencephalography (EEG), and near-infrared spectroscopy (NIRS). Newer methods which improve both spatial and time resolution are being researched, and these largely use biomarkers other than the BOLD signal. Some companies have developed commercial products such as lie detectors based on fMRI techniques, but the research is not believed to be developed enough for widespread commercial use.
Overview
The fMRI concept builds on the earlier MRI scanning technology and the discovery of properties of oxygen-rich blood. MRI brain scans use a strong, uniform, static magnetic field to align the spins of nuclei in the brain region being studied. Another magnetic field, with a gradient strength rather than a uniform one, is then applied to spatially distinguish different nuclei. Finally, a radiofrequency (RF) pulse is applied to flip the nuclear spins, with the effect depending on where they are located, due to the gradient field. After the RF pulse, the nuclei return to their original (equilibrium) spin populations, and the energy they emit is measured with a coil. The use of the gradient field allows the positions of the nuclei to be determined. MRI thus provides a static structural view of brain matter. The central thrust behind fMRI was to extend MRI to capture functional changes in the brain caused by neuronal activity. Differences in magnetic properties between arterial (oxygen-rich) and venous (oxygen-poor) blood provided this link.
Since the 1890s, it has been known that changes in blood flow and blood oxygenation in the brain (collectively known as brain hemodynamics) are closely linked to neural activity. When neurons become active, local blood flow to those brain regions increases, and oxygen-rich (oxygenated) blood displaces oxygen-depleted (deoxygenated) blood around 2 seconds later. This rises to a peak over 4–6 seconds, before falling back to the original level (and typically undershooting slightly). Oxygen is carried by the hemoglobin molecule in red blood cells. Deoxygenated hemoglobin (dHb) is more magnetic (paramagnetic) than oxygenated hemoglobin (Hb), which is virtually resistant to magnetism (diamagnetic). This difference leads to an improved MR signal since the diamagnetic blood interferes with the magnetic MR signal less. This improvement can be mapped to show which neurons are active at a time.
History
During the late 19th century, Angelo Mosso invented the 'human circulation balance', which could non-invasively measure the redistribution of blood during emotional and intellectual activity. However, although briefly mentioned by William James in 1890, the details and precise workings of this balance and the experiments Mosso performed with it remained largely unknown until the recent discovery of the original instrument as well as Mosso's reports by Stefano Sandrone and colleagues. Angelo Mosso investigated several critical variables that are still relevant in modern neuroimaging such as the 'signal-to-noise ratio', the appropriate choice of the experimental paradigm and the need for the simultaneous recording of differing physiological parameters. Mosso's manuscripts do not provide direct evidence that the balance was really able to measure changes in cerebral blood flow due to cognition, however a modern replication performed by David T Field has now demonstrated—using modern signal processing techniques unavailable to Mosso—that a balance apparatus of this type is able to detect changes in cerebral blood volume related to cognition.
In 1890, Charles Roy and Charles Sherrington first experimentally linked brain function to its blood flow, at Cambridge University. The next step to resolving how to measure blood flow to the brain was Linus Pauling's and Charles Coryell's discovery in 1936 that oxygen-rich blood with Hb was weakly repelled by magnetic fields, while oxygen-depleted blood with dHb was attracted to a magnetic field, though less so than ferromagnetic elements such as iron. Seiji Ogawa at AT&T Bell labs recognized that this could be used to augment MRI, which could study just the static structure of the brain, since the differing magnetic properties of dHb and Hb caused by blood flow to activated brain regions would cause measurable changes in the MRI signal. BOLD is the MRI contrast of dHb, discovered in 1990 by Ogawa. In a seminal 1990 study based on earlier work by Thulborn et al., Ogawa and colleagues scanned rodents in a strong magnetic field (7.0 T) MRI. To manipulate blood oxygen level, they changed the proportion of oxygen the animals breathed. As this proportion fell, a map of blood flow in the brain was seen in the MRI. They verified this by placing test tubes with oxygenated or deoxygenated blood and creating separate images. They also showed that gradient-echo images, which depend on a form of loss of magnetization called T2* decay, produced the best images. To show these blood flow changes were related to functional brain activity, they changed the composition of the air breathed by rats, and scanned them while monitoring brain activity with EEG. The first attempt to detect the regional brain activity using MRI was performed by Belliveau and colleagues at Harvard University using the contrast agent Magnevist, a paramagnetic substance remaining in the bloodstream after intravenous injection. However, this method is not popular in human fMRI, because of the inconvenience of the contrast agent injection, and because the agent stays in the blood only for a short time.
Three studies in 1992 were the first to explore using the BOLD contrast in humans. Kenneth Kwong and colleagues, using both gradient-echo and inversion recovery echo-planar imaging (EPI) sequence at a magnetic field strength of 1.5 T published studies showing clear activation of the human visual cortex. The Harvard team thereby showed that both blood flow and blood volume increased locally in activity neural tissue. Ogawa and Ugurbil conducted a similar study using a higher magnetic field (4.0 T) in Ugurbil's laboratory at the University of Minnesota, generating higher resolution images that showed activity largely following the gray matter of the brain, as would be expected; in addition, they showed that fMRI signal depended on a decrease in T2*, consistent with the BOLD mechanism. T2* decay is caused by magnetized nuclei in a volume of space losing magnetic coherence (transverse magnetization) from both bumping into one another and from experiencing differences in the magnetic field strength across locations (field inhomogeneity from a spatial gradient). Bandettini and colleagues used EPI at 1.5 T to show activation in the primary motor cortex, a brain area at the last stage of the circuitry controlling voluntary movements. The magnetic fields, pulse sequences and procedures and techniques used by these early studies are still used in current-day fMRI studies. But today researchers typically collect data from more slices (using stronger magnetic gradients), and preprocess and analyze data using statistical techniques.
Physiology
The brain does not store a lot of glucose, its primary source of energy. When neurons become active, getting them back to their original state of polarization requires actively pumping ions across the neuronal cell membranes, in both directions. The energy for those ion pumps is mainly produced from glucose. More blood flows in to transport more glucose, also bringing in more oxygen in the form of oxygenated hemoglobin molecules in red blood cells. This is from both a higher rate of blood flow and an expansion of blood vessels. The blood-flow change is localized to within 2 or 3 mm of where the neural activity is. Usually the brought-in oxygen is more than the oxygen consumed in burning glucose (it is not yet settled whether most glucose consumption is oxidative), and this causes a net decrease in deoxygenated hemoglobin (dHb) in that brain area's blood vessels. This changes the magnetic property of the blood, making it interfere less with the magnetization and its eventual decay induced by the MRI process.
The cerebral blood flow (CBF) corresponds to the consumed glucose differently in different brain regions. Initial results show there is more inflow than consumption of glucose in regions such as the amygdala, basal ganglia, thalamus and cingulate cortex, all of which are recruited for fast responses. In regions that are more deliberative, such as the lateral frontal and lateral parietal lobes, it seems that incoming flow is less than consumption. This affects BOLD sensitivity.
Hemoglobin differs in how it responds to magnetic fields, depending on whether it has a bound oxygen molecule. The dHb molecule is more attracted to magnetic fields. Hence, it distorts the surrounding magnetic field induced by an MRI scanner, causing the nuclei there to lose magnetization faster via the T2* decay. Thus MR pulse sequences sensitive to T2* show more MR signal where blood is highly oxygenated and less where it is not. This effect increases with the square of the strength of the magnetic field. The fMRI signal hence needs both a strong magnetic field (1.5 T or higher) and a pulse sequence such as EPI, which is sensitive to T2* contrast.
The physiological blood-flow response largely decides the temporal sensitivity, that is how accurately we can measure when neurons are active, in BOLD fMRI. The basic time resolution parameter (sampling time) is designated TR; the TR dictates how often a particular brain slice is excited and allowed to lose its magnetization. TRs could vary from the very short (500 ms) to the very long (3 s). For fMRI specifically, the hemodynamic response lasts over 10 seconds, rising multiplicatively (that is, as a proportion of current value), peaking at 4 to 6 seconds, and then falling multiplicatively. Changes in the blood-flow system, the vascular system, integrate responses to neuronal activity over time. Because this response is a smooth continuous function, sampling with ever-faster TRs does not help; it just gives more points on the response curve obtainable by simple linear interpolation anyway. Experimental paradigms such as staggering when a stimulus is presented at various trials can improve temporal resolution, but reduces the number of effective data points obtained.
Sign in to keep reading
11 more chapters are free with a Lably account.
BOLD hemodynamic response
The change in the MR signal from neuronal activity is called the hemodynamic response (HR). It lags the neuronal events triggering it by a couple of seconds, since it takes a while for the vascular system to respond to the brain's need for glucose. From this point it typically rises to a peak at about 5 seconds after the stimulus. If the neurons keep firing, say from a continuous stimulus, the peak spreads to a flat plateau while the neurons stay active. After activity stops, the BOLD signal falls below the original level, the baseline, a phenomenon called the undershoot. Over time the signal recovers to the baseline. There is some evidence that continuous metabolic requirements in a brain region contribute to the undershoot.
The mechanism by which the neural system provides feedback to the vascular system of its need for more glucose is partly the release of glutamate as part of neuron firing. This glutamate affects nearby supporting cells, astrocytes, causing a change in calcium ion concentration. This, in turn, releases nitric oxide at the contact point of astrocytes and intermediate-sized blood vessels, the arterioles. Nitric oxide is a vasodilator causing arterioles to expand and draw in more blood.
A single voxel's response signal over time is called its timecourse. Typically, the unwanted signal, called the noise, from the scanner, random brain activity and similar elements is as big as the signal itself. To eliminate these, fMRI studies repeat a stimulus presentation multiple times.
Spatial resolution
Spatial resolution of an fMRI study refers to how well it discriminates between nearby locations. It is measured by the size of voxels, as in MRI. A voxel is a three-dimensional rectangular cuboid, whose dimensions are set by the slice thickness, the area of a slice, and the grid imposed on the slice by the scanning process. Full-brain studies use larger voxels, while those that focus on specific regions of interest typically use smaller sizes. Sizes range from 4 to 5 mm, or with laminar resolution fMRI (lfMRI), to submillimeter. Smaller voxels contain fewer neurons on average, incorporate less blood flow, and hence have less signal than larger voxels. Smaller voxels imply longer scanning times, since scanning time directly rises with the number of voxels per slice and the number of slices. This can lead both to discomfort for the subject inside the scanner and to loss of the magnetization signal. A voxel typically contains a few million neurons and tens of billions of synapses, with the actual number depending on voxel size and the area of the brain being imaged.
The vascular arterial system supplying fresh blood branches into smaller and smaller vessels as it enters the brain surface and within-brain regions, culminating in a connected capillary bed within the brain. The drainage system, similarly, merges into larger and larger veins as it carries away oxygen-depleted blood. The dHb contribution to the fMRI signal is from both the capillaries near the area of activity and larger draining veins that may be farther away. For good spatial resolution, the signal from the large veins needs to be suppressed, since it does not correspond to the area where the neural activity is. This can be achieved either by using strong static magnetic fields or by using spin-echo pulse sequences. With these, fMRI can examine a spatial range from millimeters to centimeters, and can hence identify Brodmann areas (centimeters), subcortical nuclei such as the caudate, putamen and thalamus, and hippocampal subfields such as the combined dentate gyrus/CA3, CA1, and subiculum.
Temporal resolution
Temporal resolution is the smallest time period of neural activity reliably separated out by fMRI. One element deciding this is the sampling time, the TR. Below a TR of 1 or 2 seconds, however, scanning just generates sharper hemodynamic response (HR) curves, without adding much additional information (e.g. beyond what is alternatively achieved by mathematically interpolating the curve gaps at a lower TR). Temporal resolution can be improved by staggering stimulus presentation across trials. If one-third of data trials are sampled normally, one-third at 1 s, 4 s, 7 s and so on, and the last third at 2 s, 5 s and 8 s, the combined data provide a resolution of 1 s, though with only one-third as many total events.
The time resolution needed depends on brain processing time for various events. An example of the broad range here is given by the visual processing system. What the eye sees is registered on the photoreceptors of the retina within a millisecond or so. These signals get to the primary visual cortex via the thalamus in tens of milliseconds. Neuronal activity related to the act of seeing lasts for more than 100 ms. A fast reaction, such as swerving to avoid a car crash, takes around 200 ms. By about half a second, awareness and reflection of the incident sets in. Remembering a similar event may take a few seconds, and emotional or physiological changes such as fear arousal may last minutes or hours. Learned changes, such as recognizing faces or scenes, may last days, months, or years. Most fMRI experiments study brain processes lasting a few seconds, with the study conducted over some tens of minutes. Subjects may move their heads during that time, and this head motion needs to be corrected for. So does drift in the baseline signal over time. Boredom and learning may modify both subject behavior and cognitive processes.
Linear addition from multiple activation
When a person performs two tasks simultaneously or in overlapping fashion, the BOLD response is expected to add linearly. This is a fundamental assumption of many fMRI studies that is based on the principle that continuously differentiable systems can be expected to behave linearly when perturbations are small; they are linear to first order. Linear addition means the only operation allowed on the individual responses before they are combined (added together) is a separate scaling of each. Since scaling is just multiplication by a constant number, this means an event that evokes, say, twice the neural response as another, can be modeled as the first event presented twice simultaneously. The HR for the doubled-event is then just double that of the single event.
To the extent that the behavior is linear, the time course of the BOLD response to an arbitrary stimulus can be modeled by convolution of that stimulus with the impulse BOLD response. Accurate time course modeling is important in estimating the BOLD response magnitude.
This strong assumption was first studied in 1996 by Boynton and colleagues, who checked the effects on the primary visual cortex of patterns flickering 8 times a second and presented for 3 to 24 seconds. Their result showed that when visual contrast of the image was increased, the HR shape stayed the same but its amplitude increased proportionally. With some exceptions, responses to longer stimuli could also be inferred by adding together the responses for multiple shorter stimuli summing to the same longer duration. In 1997, Dale and Buckner tested whether individual events, rather than blocks of some duration, also summed the same way, and found they did. But they also found deviations from the linear model at time intervals less than 2 seconds.
A source of nonlinearity in the fMRI response is from the refractory period, where brain activity from a presented stimulus suppresses further activity on a subsequent, similar, stimulus. As stimuli become shorter, the refractory period becomes more noticeable. The refractory period does not change with age, nor do the amplitudes of HRs. The period differs across brain regions. In both the primary motor cortex and the visual cortex, the HR amplitude scales linearly with duration of a stimulus or response. In the corresponding secondary regions, the supplementary motor cortex, which is involved in planning motor behavior, and the motion-sensitive V5 region, a strong refractory period is seen and the HR amplitude stays steady across a range of stimulus or response durations. The refractory effect can be used in a way similar to habituation to see what features of a stimulus a person discriminates as new. Further limits to linearity exist because of saturation: with large stimulation levels a maximum BOLD response is reached.
Matching neural activity to the BOLD signal
Researchers have checked the BOLD signal against both signals from implanted electrodes (mostly in monkeys) and signals of field potentials (that is the electric or magnetic field from the brain's activity, measured outside the skull) from EEG and MEG. The local field potential, which includes both post-neuron-synaptic activity and internal neuron processing, better predicts the BOLD signal. So the BOLD contrast reflects mainly the inputs to a neuron and the neuron's integrative processing within its body, and less the output firing of neurons. In humans, electrodes can be implanted only in patients who need surgery as treatment, but evidence suggests a similar relationship at least for the auditory cortex and the primary visual cortex. Activation locations detected by BOLD fMRI in cortical areas (brain surface regions) are known to tally with CBF-based functional maps from PET scans. Some regions just a few millimeters in size, such as the lateral geniculate nucleus (LGN) of the thalamus, which relays visual inputs from the retina to the visual cortex, have been shown to generate the BOLD signal correctly when presented with visual input. Nearby regions such as the pulvinar nucleus were not stimulated for this task, indicating millimeter resolution for the spatial extent of the BOLD response, at least in thalamic nuclei. In the rat brain, single-whisker touch has been shown to elicit BOLD signals from the somatosensory cortex.
However, the BOLD signal cannot separate feedback and feedforward active networks in a region; the slowness of the vascular response means the final signal is the summed version of the whole region's network; blood flow is not discontinuous as the processing proceeds. Also, both inhibitory and excitatory input to a neuron from other neurons sum and contribute to the BOLD signal. Within a neuron these two inputs might cancel out. The BOLD response can also be affected by a variety of factors, including disease, sedation, anxiety, medications that dilate blood vessels, and attention (neuromodulation).
The amplitude of the BOLD signal does not necessarily affect its shape. A higher-amplitude signal may be seen for stronger neural activity, but peaking at the same place as a weaker signal. Also, the amplitude does not necessarily reflect behavioral performance. A complex cognitive task may initially trigger high-amplitude signals associated with good performance, but as the subject gets better at it, the amplitude may decrease with performance staying the same. This is expected to be due to increased efficiency in performing the task. The BOLD response across brain regions cannot be compared directly even for the same task, since the density of neurons and the blood-supply characteristics are not constant across the brain. However, the BOLD response can often be compared across subjects for the same brain region and the same task.
More recent characterization of the BOLD signal has used optogenetic techniques in rodents to precisely control neuronal firing while simultaneously monitoring the BOLD response using high field magnets (a technique sometimes referred to as "optofMRI"). These techniques suggest that neuronal firing is well correlated with the measured BOLD signal including approximately linear summation of the BOLD signal over closely spaced bursts of neuronal firing. Linear summation is an assumption of commonly used event-related fMRI designs.
Medical use
Physicians use fMRI to assess how risky brain surgery or similar invasive treatment is for a patient and to learn how a normal, diseased or injured brain is functioning. They map the brain with fMRI to identify regions linked to critical functions such as speaking, moving, sensing, or planning. This is useful to plan for surgery and radiation therapy of the brain.
Clinical use of fMRI still lags behind research use. Patients with brain pathologies are more difficult to scan with fMRI than are young healthy volunteers, the typical research-subject population. Tumors and lesions can change the blood flow in ways not related to neural activity, masking the neural HR. Drugs such as antihistamines and even caffeine can affect HR. Some patients may have disorders such as compulsive lying, which makes certain studies impossible. It is harder for those with clinical problems to stay still for long. Using head restraints or bite bars may injure epileptics who have a seizure inside the scanner; bite bars may also discomfort those with dental prostheses.
Despite these difficulties, fMRI has been used clinically to map functional areas, check left-right hemispherical asymmetry in language and memory regions, check the neural correlates of a seizure, study how the brain recovers partially from a stroke, and test how well a drug or behavioral therapy works. Mapping of functional areas and understanding lateralization of language and memory help surgeons avoid removing critical brain regions when they have to operate and remove brain tissue. This is of particular importance in removing tumors and in patients who have intractable temporal lobe epilepsy. Lesioning tumors requires pre-surgical planning to ensure no functionally useful tissue is removed needlessly. Recovered depressed patients have shown altered fMRI activity in the cerebellum, and this may indicate a tendency to relapse. Pharmacological fMRI, assaying brain activity after drugs are administered, can be used to check how much a drug penetrates the blood–brain barrier and dose vs effect information of the medication.
Animal research
Research is primarily performed in non-human primates such as the rhesus macaque. These studies can be used both to check or predict human results and to validate the fMRI technique itself. But the studies are difficult because it is hard to motivate an animal to stay still and typical inducements such as juice trigger head movement while the animal swallows it. It is also expensive to maintain a colony of larger animals such as the macaque.
Analyzing the data
The goal of fMRI data analysis is to detect correlations between brain activation and a task the subject performs during the scan. It also aims to discover correlations with the specific cognitive states, such as memory and recognition, induced in the subject. The BOLD signature of activation is relatively weak, however, so other sources of noise in the acquired data must be carefully controlled. This means that a series of processing steps must be performed on the acquired images before the actual statistical search for task-related activation can begin. Nevertheless, it is possible to predict, for example, the emotions a person is experiencing solely from their fMRI, with a high degree of accuracy.
Sources of noise
Noise is unwanted changes to the MR signal from elements not of interest to the study. The five main sources of noise in fMRI are thermal noise, system noise, physiological noise, random neural activity and differences in both mental strategies and behavior across people and across tasks within a person. Thermal noise multiplies in line with the static field strength, but physiological noise multiplies as the square of the field strength. Since the signal also multiplies as the square of the field strength, and since physiological noise is a large proportion of total noise, higher field strengths above 3 T do not always produce proportionately better images.
Heat causes electrons to move around and distort the current in the fMRI detector, producing thermal noise. Thermal noise rises with the temperature. It also depends on the range of frequencies detected by the receiver coil and its electrical resistance. It affects all voxels similarly, independent of anatomy.
System noise is from the imaging hardware. One form is scanner drift, caused by the superconducting magnet's field drifting over time. Another form is changes in the current or voltage distribution of the brain itself inducing changes in the receiver coil and reducing its sensitivity. A procedure called impedance matching is used to bypass this inductance effect. There could also be noise from the magnetic field not being uniform. This is often adjusted for by using shimming coils, small magnets physically inserted, say into the subject's mouth, to patch the magnetic field. The nonuniformities are often near brain sinuses such as the ear and plugging the cavity for long periods can be discomfiting. The scanning process acquires the MR signal in k-space, in which overlapping spatial frequencies (that is repeated edges in the sample's volume) are each represented with lines. Transforming this into voxels introduces some loss and distortions.
Physiological noise is from head and brain movement in the scanner from breathing, heart beats, or the subject fidgeting, tensing, or making physical responses such as button presses. Head movements cause the voxel-to-neurons mapping to change while scanning is in progress. Noise due to head movement is a particular issue when working with children, although there are measures that can be taken to reduce head motion when scanning children, such as changes in experimental design and training prior to the scanning session. Since fMRI is acquired in slices, after movement, a voxel continues to refer to the same absolute location in space while the neurons underneath it would have changed. Another source of physiological noise is the change in the rate of blood flow, blood volume, and use of oxygen over time. This last component contributes to two-thirds of physiological noise, which, in turn, is the main contributor to total noise.
Even with the best experimental design, it is not possible to control and constrain all other background stimuli impinging on a subject—scanner noise, random thoughts, physical sensations, and the like. These produce neural activity independent of the experimental manipulation. These are not amenable to mathematical modeling and have to be controlled by the study design.
A person's strategies to respond or react to a stimulus, and to solve problems, often change over time and over tasks. This generates variations in neural activity from trial to trial within a subject. Across people too neural activity differs for similar reasons. Researchers often conduct pilot studies to see how participants typically perform for the task under consideration. They also often train subjects how to respond or react in a trial training session prior to the scanning one.
Preprocessing
The scanner platform generates a 3 D volume of the subject's head every TR. This consists of an array of voxel intensity values, one value per voxel in the scan. The voxels are arranged one after the other, unfolding the three-dimensional structure into a single line. Several such volumes from a session are joined to form a 4 D volume corresponding to a run, for the time period the subject stayed in the scanner without adjusting head position. This 4 D volume is the starting point for analysis. The first part of that analysis is preprocessing.
The first step in preprocessing is conventionally slice timing correction. The MR scanner acquires different slices within a single brain volume at different times, and hence the slices represent brain activity at different timepoints. Since this complicates later analysis, a timing correction is applied to bring all slices to the same timepoint reference. This is done by assuming the timecourse of a voxel is smooth when plotted as a dotted line. Hence the voxel's intensity value at other times not in the sampled frames can be calculated by filling in the dots to create a continuous curve.
Head motion correction is another common preprocessing step. When the head moves, the neurons under a voxel move and hence its timecourse now represents largely that of some other voxel in the past. Hence the timecourse curve is effectively cut and pasted from one voxel to another. Motion correction tries different ways of undoing this to see which undoing of the cut-and-paste produces the smoothest timecourse for all voxels. The undoing is by applying a rigid-body transform to the volume, by shifting and rotating the whole volume data to account for motion. The transformed volume is compared statistically to the volume at the first timepoint to see how well they match, using a cost function such as correlation or mutual information. The transformation that gives the minimal cost function is chosen as the model for head motion. Since the head can move in a vastly varied number of ways, it is not possible to search for all possible candidates; nor is there right now an algorithm that provides a globally optimal solution independent of the first transformations we try in a chain.
Distortion corrections account for field nonuniformities of the scanner. One method, as described before, is to use shimming coils. Another is to recreate a field map of the main field by acquiring two images with differing echo times. If the field were uniform, the differences between the two images also would be uniform. Note these are not true preprocessing techniques since they are independent of the study itself. Bias field estimation is a real preprocessing technique using mathematical models of the noise from distortion, such as Markov random fields and expectation maximization algorithms, to correct for distortion.
In general, fMRI studies acquire both many functional images with fMRI and a structural image with MRI. The structural image is usually of a higher resolution and depends on a different signal, the T1 magnetic field decay after excitation. To demarcate regions of interest in the functional image, one needs to align it with the structural one. Even when whole-brain analysis is done, to interpret the final results, that is to figure out which regions the active voxels fall in, one has to align the functional image to the structural one. This is done with a coregistration algorithm that works similar to the motion-correction one, except that here the resolutions are different, and the intensity values cannot be directly compared since the generating signal is different.
Typical MRI studies scan a few different subjects. To integrate the results across subjects, one possibility is to use a common brain atlas, and adjust all the brains to align to the atlas, and then analyze them as a single group. The atlases commonly used are the Talairach one, a single brain of an elderly woman created by Jean Talairach, and the Montreal Neurological Institute (MNI) one. The second is a probabilistic map created by combining scans from over a hundred individuals. This normalization to a standard template is done by mathematically checking which combination of stretching, squeezing, and warping reduces the differences between the target and the reference. While this is conceptually similar to motion correction, the changes required are more complex than just translation and rotation, and hence optimization even more likely to depend on the first transformations in the chain that is checked.
Temporal filtering is the removal of frequencies of no interest from the signal. A voxel's intensity change over time can be represented as the sum of a number of different repeating waves with differing periods and heights. A plot with these periods on the x-axis and the heights on the y-axis is called a power spectrum, and this plot is created with the Fourier transform technique. Temporal filtering amounts to removing the periodic waves not of interest to us from the power spectrum, and then summing the waves back again, using the inverse Fourier transform to create a new timecourse for the voxel. A high-pass filter removes the lower frequencies, and the lowest frequency that can be identified with this technique is the reciprocal of twice the TR. A low-pass filter removes the higher frequencies, while a band-pass filter removes all frequencies except the particular range of interest.
Smoothing, or spatial filtering, is the idea of averaging the intensities of nearby voxels to produce a smooth spatial map of intensity change across the brain or region of interest. The averaging is often done by convolution with a Gaussian filter, which, at every spatial point, weights neighboring voxels by their distance, with the weights falling exponentially following the bell curve. If the true spatial extent of activation, that is the spread of the cluster of voxels simultaneously active, matches the width of the filter used, this process improves the signal-to-noise ratio. It also makes the total noise for each voxel follow a bell-curve distribution, since adding together a large number of independent, identical distributions of any kind produces the bell curve as the limit case. But if the presumed spatial extent of activation does not match the filter, signal is reduced.
Statistical analysis
One common approach to analysing fMRI data is to consider each voxel separately within the framework of the general linear model. The model assumes, at every time point, that the hemodynamic response (HR) is equal to the scaled and summed version of the events active at that point. A researcher creates a design matrix specifying which events are active at any timepoint. One common way is to create a matrix with one column per overlapping event, and one row per time point, and to mark it if a particular event, say a stimulus, is active at that time point. One then assumes a specific shape for the HR, leaving only its amplitude changeable in active voxels. The design matrix and this shape are used to generate a prediction of the exact HR of the voxel at every timepoint, using the mathematical procedure of convolution. This prediction does not include the scaling required for every event before summing them.
The basic model assumes the observed HR is the predicted HR scaled by the weights for each event and then added, with noise mixed in. This generates a set of linear equations with more equations than unknowns. A linear equation has an exact solution, under most conditions, when equations and unknowns match. Hence one could choose any subset of the equations, with the number equal to the number of variables, and solve them. But, when these solutions are plugged into the left-out equations, there will be a mismatch between the right and left sides, the error. The GLM model attempts to find the scaling weights that minimize the sum of the squares of the error. This method is provably optimal if the error were distributed as a bell curve, and if the scaling-and-summing model were accurate. For a more mathematical description of the GLM model, see generalized linear models.
The GLM model does not take into account the contribution of relationships between multiple voxels. Whereas GLM analysis methods assess whether a voxel or region's signal amplitude is higher or lower for one condition than another, newer statistical models such as multi-voxel pattern analysis (MVPA), utilize the unique contributions of multiple voxels within a voxel-population. In a typical implementation, a classifier or more basic algorithm is trained to distinguish trials for different conditions within a subset of the data. The trained model is then tested by predicting the conditions of the remaining (independent) data. This approach is most typically achieved by training and testing on different scanner sessions or runs. If the classifier is linear, then the training model is a set of weights used to scale the value in each voxel before summing them to generate a single number that determines the condition for each testing set trial. More information on training and testing classifiers is at statistical classification. MVPA allows for inferences about the information content of the underlying neural representations reflected in the BOLD signal, though there is a controversy about whether information detected by this method reflects information encoded at the level of columns, or higher spatial scales. Moreover, its harder to decode information from the prefrontal cortex compared to visual cortex and such differences in sensitivity across regions makes comparisons across regions problematic. Another method used the same fMRI dataset for visual object recognition in the human brain is depending on multi-voxel pattern analysis (fMRI voxels) and multi-view learning which is described in, this method used meta-heuristic search and mutual information to eliminate noisy voxels and select the significant BOLD signals.
Combining with other methods
It is common to combine fMRI signal acquisition with tracking of participants' responses and reaction times. Physiological measures such as heart rate, breathing, skin conductance (rate of sweating), and eye movements are sometimes captured simultaneously with fMRI. The method can also be combined with other brain-imaging techniques such as transcranial stimulation, direct cortical stimulation and, especially, EEG. The fMRI procedure can also be combined with near-infrared spectroscopy (NIRS) to have supplementary information about both oxyhemoglobin and deoxyhemoglobin.
The fMRI technique can complement or supplement other techniques because of its unique strengths and gaps. It can noninvasively record brain signals without risks of ionising radiation inherent in other scanning methods, such as CT or PET scans. It can also record signal from all regions of the brain, unlike EEG/MEG, which are biased toward the cortical surface. But fMRI temporal resolution is poorer than that of EEG since the HR takes tens of seconds to climb to its peak. Combining EEG with fMRI is hence potentially powerful because the two have complementary strengths—EEG has high temporal resolution, and fMRI high spatial resolution. But simultaneous acquisition needs to account for the EEG signal from varying blood flow triggered by the fMRI gradient field, and the EEG signal from the static field. For details, see EEG vs fMRI.
While fMRI stands out due to its potential to capture neural processes associated with health and disease, brain stimulation techniques such as transcranial magnetic stimulation (TMS) have the power to alter these neural processes. Therefore, a combination of both is needed to investigate the mechanisms of action of TMS treatment and on the other hand introduce causality into otherwise pure correlational observations. The current state-of-the-art setup for these concurrent TMS/fMRI experiments comprises a large-volume head coil, usually a birdcage coil, with the MR-compatible TMS coil being mounted inside that birdcage coil. It was applied in a multitude of experiments studying local and network interactions. However, classic setups with the TMS coil placed inside MR birdcage-type head coil are characterised by poor signal to noise ratios compared to multi-channel receive arrays used in clinical neuroimaging today. Moreover, the presence of the TMS coil inside the MR birdcage coil causes artefacts beneath the TMS coil, i.e. at the stimulation target. For these reasons new MR coil arrays were currently developed dedicated to concurrent TMS/fMRI experiments.
Issues in fMRI
Design
If the baseline condition is too close to maximum activation, certain processes may not be represented appropriately. Another limitation on experimental design is head motion, which can lead to artificial intensity changes of the fMRI signal.
Block versus event-related design
In a block design, two or more conditions are alternated by blocks. Each block will have a duration of a certain number of fMRI scans and within each block only one condition is presented. By making the conditions differ in only the cognitive process of interest, the fMRI signal that differentiates the conditions should represent this cognitive process of interest. This is known as the subtraction paradigm. The increase in fMRI signal in response to a stimulus is additive. This means that the amplitude of the hemodynamic response (HR) increases when multiple stimuli are presented in rapid succession. When each block is alternated with a rest condition in which the HR has enough time to return to baseline, a maximum amount of variability is introduced in the signal. As such, we conclude that block designs offer considerable statistical power. There are however severe drawbacks to this method, as the signal is very sensitive to signal drift, such as head motion, especially when only a few blocks are used. Another limiting factor is a poor choice of baseline, as it may prevent meaningful conclusions from being drawn. There are also problems with many tasks lacking the ability to be repeated. Since within each block only one condition is presented, randomization of stimulus types is not possible within a block. This makes the type of stimulus within each block very predictable. As a consequence, participants may become aware of the order of the events.
Event-related designs allow more real world testing, however, the statistical power of event related designs is inherently low, because the signal change in the BOLD fMRI signal following a single stimulus presentation is small.
Both block and event-related designs are based on the subtraction paradigm, which assumes that specific cognitive processes can be added selectively in different conditions. Any difference in blood flow (the BOLD signal) between these two conditions is then assumed to reflect the differing cognitive process. In addition, this model assumes that a cognitive process can be selectively added to a set of active cognitive processes without affecting them.
Overlap of signals
Overlapping signals in fMRI are a significant challenge in cognitive neuroscience research, particularly when multiple stimuli or tasks are presented in close temporal proximity. The BOLD response has a slow temporal resolution compared to the rapid succession of cognitive events. This causes signals from different brain processes to overlap, making it difficult to differentiate which neural activity is associated with specific stimuli or tasks. This overlap reduces the precision of event-related fMRI analyses, complicating interpretations of brain function.
Traditional fMRI designs, such as block or event-related designs, face limitations in managing this signal overlap, especially in studies with non-randomized, alternating designs, where the same tasks or stimuli may appear repeatedly and close together. As a result, the timing of stimuli becomes a crucial factor in ensuring that the fMRI signal from one event is sufficiently distinct from the next.
To address these challenges, researchers employ techniques like deconvolution, which mathematically separates the overlapping BOLD responses. In 2023, Das and colleagues demonstrated various ways on optimizing timing between individual events such that convolution of signals evoked by them that are close to each other can be minimized. These methods attempt to estimate the contribution of each neural event to the overall signal, allowing for more accurate interpretation of brain activity. Advances in analytical methods, such as specialized tools for optimizing experimental designs, are crucial for mitigating the effects of signal overlap and improving the reliability of fMRI studies.
Baseline versus activity conditions
The brain is never completely at rest. It never stops functioning and firing neuronal signals, as well as using oxygen as long as the person in question is alive. In fact, in Stark and Squire's, 2001 study When zero is not zero: The problem of ambiguous baseline conditions in fMRI, activity in the medial temporal lobe (as well as in other brain regions) was substantially higher during rest than during several alternative baseline conditions. The effect of this elevated activity during rest was to reduce, eliminate, or even reverse the sign of the activity during task conditions relevant to memory functions. These results demonstrate that periods of rest are associated with significant cognitive activity and are therefore not an optimal baseline for cognition tasks. In order to discern baseline and activation conditions it is necessary to interpret a lot of information. This includes situations as simple as breathing. Periodic blocks may result in identical data of other variance in the data if the person breathes at a regular rate of 1 breath/5sec, and the blocks occur every 10s, thus impairing the data.
Reverse inference
Neuroimaging methods such as fMRI and MRI offer a measure of the activation of certain brain areas in response to cognitive tasks engaged in during the scanning process. Data obtained during this time allow cognitive neuroscientists to gain information regarding the role of particular brain regions in cognitive function. However, an issue arises when certain brain regions are alleged by researchers to identify the activation of previously labeled cognitive processes. Poldrack clearly describes this issue:
- The usual kind of inference that is drawn from neuroimaging data is of the form 'if cognitive process X is engaged, then brain area Z is active.' Perusal of the discussion sections of a few fMRI articles will quickly reveal, however, an epidemic of reasoning taking the following form:
- (1) In the present study, when task comparison A was presented, brain area Z was active.
- (2) In other studies, when cognitive process X was putatively engaged, then brain area Z was active.
- (3) Thus, the activity of area Z in the present study demonstrates engagement of cognitive process X by task comparison A.
- This is a 'reverse inference', in that it reasons backwards from the presence of brain activation to the engagement of a particular cognitive function.
Reverse inference demonstrates the logical fallacy of affirming what you just found, although this logic could be supported by instances where a certain outcome is generated solely by a specific occurrence. With regard to the brain and brain function it is seldom that a particular brain region is activated solely by one cognitive process. Some suggestions to improve the legitimacy of reverse inference have included both increasing the selectivity of response in the brain region of interest and increasing the prior probability of the cognitive process in question. However, Poldrack suggests that reverse inference should be used merely as a guide to direct further inquiry rather than a direct means to interpret results.
Forward inference
Forward inference is a data driven method that uses patterns of brain activation to distinguish between competing cognitive theories. It shares characteristics with cognitive psychology's dissociation logic and philosophy's forward chaining. For example, Henson discusses forward inference's contribution to the "single process theory vs. dual process theory" debate with regard to recognition memory. Forward inference supports the dual process theory by demonstrating that there are two qualitatively different brain activation patterns when distinguishing between "remember vs. know judgments". The main issue with forward inference is that it is a correlational method. Therefore, one cannot be completely confident that brain regions activated during cognitive process are completely necessary for that execution of those processes. In fact, there are many known cases that demonstrate just that. For example, the hippocampus has been shown to be activated during classical conditioning, however lesion studies have demonstrated that classical conditioning can occur without the hippocampus.
Health risks
The most common risk to participants in an fMRI study is claustrophobia and there are reported risks for pregnant women to go through the scanning process. Scanning sessions also subject participants to loud high-pitched noises from Lorentz forces induced in the gradient coils by the rapidly switching current in the powerful static field. The gradient switching can also induce currents in the body causing nerve tingling. Implanted medical devices such as pacemakers could malfunction because of these currents. The radio-frequency field of the excitation coil may heat up the body, and this has to be monitored more carefully in those running a fever, the diabetic, and those with circulatory problems. Local burning from metal necklaces and other jewellery is also a risk.
The strong static magnetic field can cause damage by pulling in nearby heavy metal objects converting them to projectiles.
There is no proven risk of biological harm from even very powerful static magnetic fields. However, genotoxic (i.e., potentially carcinogenic) effects of MRI scanning have been demonstrated in vivo and in vitro, leading a recent review to recommend "a need for further studies and prudent use in order to avoid unnecessary examinations, according to the precautionary principle". In a comparison of genotoxic effects of MRI compared with those of CT scans, Knuuti et al. reported that even though the DNA damage detected after MRI was at a level comparable to that produced by scans using ionizing radiation (low-dose coronary CT angiography, nuclear imaging, and X-ray angiography), differences in the mechanism by which this damage takes place suggests that the cancer risk of MRI, if any, is unknown.
Advanced methods
The first fMRI studies validated the technique against brain activity known, from other techniques, to be correlated to tasks. By the early 2000s, fMRI studies began to discover novel correlations. Still their technical disadvantages have spurred researchers to try more advanced ways to increase the power of both clinical and research studies.
Better spatial resolution
MRI, in general, has better spatial resolution than EEG and MEG, but not as good a resolution as invasive procedures such as single-unit electrodes. While typical resolutions are in the millimeter range, ultra-high-resolution MRI or MR spectroscopy works at a resolution of tens of micrometers. It uses 7 T fields, small-bore scanners that can fit small animals such as rats, and external contrast agents such as fine iron oxide. Fitting a human requires larger-bore scanners, which make higher fields strengths harder to achieve, especially if the field has to be uniform; it also requires either internal contrast such as BOLD or a non-toxic external contrast agent unlike iron oxide.
Parallel imaging is another technique to improve spatial resolution. This uses multiple coils for excitation and reception. Spatial resolution improves as the square root of the number of coils used. This can be done either with a phased array where the coils are combined in parallel and often sample overlapping areas with gaps in the sampling or with massive coil arrays, which are a much denser set of receivers separate from the excitation coils. These, however, pick up signals better from the brain surface, and less well from deeper structures such as the hippocampus.
Better temporal resolution
Temporal resolution of fMRI is limited by: (1) the feedback mechanism that raises the blood flow operating slowly; (2) having to wait until net magnetization recovers before sampling a slice again; and (3) having to acquire multiple slices to cover the whole brain or region of interest. Advanced techniques to improve temporal resolution address these issues. Using multiple coils speeds up acquisition time in exact proportion to the coils used. Another technique is to decide which parts of the signal matter less and drop those. This could be either those sections of the image that repeat often in a spatial map (that is small clusters dotting the image periodically) or those sections repeating infrequently (larger clusters). The first, a high-pass filter in k-space, has been proposed by Gary H. Glover and colleagues at Stanford. These mechanisms assume the researcher has an idea of the expected shape of the activation image.
Typical gradient-echo EPI uses two gradient coils within a slice, and turns on first one coil and then the other, tracing a set of lines in k-space. Turning on both gradient coils can generate angled lines, which cover the same grid space faster. Both gradient coils can also be turned on in a specific sequence to trace a spiral shape in k-space. This spiral imaging sequence acquires images faster than gradient-echo sequences, but needs more math transformations (and consequent assumptions) since converting back to voxel space requires the data be in grid form (a set of equally spaced points in both horizontal and vertical directions).
New contrast mechanisms
BOLD contrast depends on blood flow, which is both sluggish in response to stimulus and subject to noisy influences. Other biomarkers now looked at to provide better contrast include temperature, acidity/alkalinity (pH), calcium-sensitive agents, neuronal magnetic field, and the Lorentz effect. Temperature contrast depends on changes in brain temperature from its activity. The initial burning of glucose raises the temperature, and the subsequent inflow of fresh, cold blood lowers it. These changes alter the magnetic properties of tissue. Since the internal contrast is too difficult to measure, external agents such as thulium compounds are used to enhance the effect. Contrast based on pH depends on changes in the acid/alkaline balance of brain cells when they go active. This too often uses an external agent. Calcium-sensitive agents make MRI more sensitive to calcium concentrations, with calcium ions often being the messengers for cellular signalling pathways in active neurons. Neuronal magnetic field contrast measures the magnetic and electric changes from neuronal firing directly. Lorentz-effect imaging tries to measure the physical displacement of active neurons carrying an electric current within the strong static field.
Vascular-space occupancy (VASO) measures changes in cerebral blood volume (CBV), which is a less ambiguous marker of neural activity than BOLD. The signal intensity is inversely proportional to CBV, with typical signal changes around -1.5%. It relies on the T₁ difference between blood and the surrounding tissue. Because it nulls the blood signal, VASO eliminates the large veins contribution to the MR signal, reducing the risk of falsely localizing brain activity to nearby draining veins, and achieving high spatial specificity, which makes the technique well-suited for layer-specific fMRI. VASO allows for the reliable quantification of physiological parameters such as the cerebral metabolic rate of oxygen or the oxygen extraction fraction. However, the approach suffers from some limitations compared to techniques that rely on the BOLD signal. VASO generally has lower sensitivity, lower SNR and lower CNR, as well as reduced imaging efficiency and higher susceptibility to motion artifacts.
Emerging acquisition strategies
Balanced Steady-State Free Precession (bSSFP) fMRI: bSSFP offers high SNR efficiency due to optimized magnetization usage, leading to high tSNR. It also features reduced distortion because of its short readouts, minimizing susceptibility-induced distortion and signal dropout compared to GRE-EPI. It's compatible with advanced short-readout strategies like multi-shot, spiral, and radial trajectories. However, bSSFP is prone to banding artifacts from off-resonance effects and has a complex contrast mechanism influenced by T₂/T₁, diffusion, and off-resonance. It also tends to have a higher SAR compared to GRE sequences. Pass-Band bSSFP: This variant has a flat magnitude response over a broad frequency range (approximately 75% of 1/TR). Its contrast is T₂-based, driven by diffusion in susceptibility gradients and intravascular T₂ changes, with low sensitivity to frequency shifts. While offering lower contrast than long-TE GRE, it provides superior robustness to off-resonance and shim variations, making efficient whole-brain coverage achievable with minimal phase cycling. Larger Flip angles could be used to operate in Passband region. Transition-Band bSSFP: This type operates within a narrow frequency range (around 10–15% of 1/TR) with a steep magnitude and phase response. Its BOLD sensitivity is frequency-driven, where small frequency shifts cause large signal changes, potentially yielding high functional contrast (10–40%). However, this makes it highly dependent on the baseline resonance frequency of the voxel and critical of shimming quality, challenging whole-brain coverage without multiple acquisitions. Applications: bSSFP techniques can be beneficial for layer-specific imaging or studies requiring high SNR and excellent temporal resolution, especially in low-field or low-SNR brain regions.
Multi-echo, Multi-contrast (SAGE) fMRI: SAGE techniques aim to combine the high sensitivity of multi-gradient echo (MGE) with the microvascular specificity of spin-echo (SE). They simultaneously acquire multiple gradient-echoes and spin-echoes (e.g., 2 GRE, 2 Asymmetric SE, 1 SE), allowing for optimized Contrast-to-Noise Ratio (CNR) and temporal Signal-to-Noise Ratio (tSNR) across varying T₂* values. Echoes can be weighted to emphasize either T₂*-BOLD contrast (wT₂*), similar to GRE, or T₂-BOLD contrast (wT₂), similar to SE. For instance, wT₂* weighting uses pre-refocusing GREs and Asymmetric Spin Echoes (ASEs), while wT₂ weighting uses post-refocusing ASEs and the pure SE. This method is particularly useful for studies focused on vascular physiology or when needing to avoid interscan variability. A limitation is its reliance on acceleration methods like multiband (MB) or SENSE.
Silent fMRI: Based on 3D radial Rotating Ultra-Fast Imaging Sequence (RUFIS), Looping Star enhances RUFIS/Zero Echo Time (ZTE) by adding time-multiplexed gradient refocusing. This enables multi-echo acquisition beyond the initial FID (TE ≈ 0) to provide essential T₂* BOLD contrast. Its primary advantage is significantly reduced acoustic noise, approximately 25 dBA quieter than conventional GRE-EPI (a ~98% reduction). Limitations include potential echo mixing artifacts requiring correction and possibly reduced tSNR and BOLD sensitivity compared to GRE-EPI. Studies have shown that while looping star identifies similar activation networks to GE-EPI, it may exhibit reduced activation extent and lower T-values due to lower tSNR. Its BOLD sensitivity was found to be around 69.5% relative to GE-EPI. Applications: Silent fMRI techniques are particularly valuable for auditory tasks (to avoid stimulus-correlated scanner noise), pediatric studies, or examining subjects sensitive to loud noise.
Commercial use
Some experiments have shown the neural correlates of peoples' brand preferences. Samuel M. McClure used fMRI to show the dorsolateral prefrontal cortex, hippocampus and midbrain were more active when people knowingly drank Coca-Cola as opposed to when they drank unlabeled Coke. Other studies have shown the brain activity that characterizes men's preference for sports cars, and even differences between Democrats and Republicans in their reaction to campaign commercials with images of the 9/11 attacks. Neuromarketing companies have seized on these studies as a better tool to poll user preferences than the conventional survey technique. One such company was BrightHouse, now shut down. Another is Oxford, UK-based Neurosense, which advises clients how they could potentially use fMRI as part of their marketing business activity. A third is Sales Brain in California.
At least two companies have been set up to use fMRI in lie detection: No Lie MRI and the Cephos Corporation. No Lie MRI charges close to $5000 for its services. These companies depend on evidence such as that from a study by Joshua Greene at Harvard University suggesting the prefrontal cortex is more active in those contemplating lying.
However, there is still a fair amount of controversy over whether these techniques are reliable enough to be used in a legal setting. Some studies indicate that while there is an overall positive correlation, there is a great deal of variation between findings and in some cases considerable difficulty in replicating the findings. A federal magistrate judge in Tennessee prohibited fMRI evidence to back up a defendant's claim of telling the truth, on the grounds that such scans do not measure up to the legal standard of scientific evidence.. Most researchers agree that the ability of fMRI to detect deception in a real life setting has not been established.
Use of the fMRI has been left out of legal debates throughout its history. Use of this technology has not been allowed due to holes in the evidence supporting fMRI. First, most evidence supporting fMRIs accuracy was done in a lab under controlled circumstances with solid facts. This type of testing does not pertain to real life. Real-life scenarios can be much more complicated with many other affecting factors. It has been shown that many other factors affect BOLD other than a typical lie. There have been tests done showing that drug use alters blood flow in the brain, which drastically affects the outcome of BOLD testing. Furthermore, individuals with diseases or disorders such as schizophrenia or compulsive lying can lead to abnormal results as well. Lastly, there is an ethical question relating to fMRI scanning. This testing of BOLD has led to controversy over if fMRIs are an invasion of privacy. Being able to scan and interpret what people are thinking may be thought of as immoral and the controversy still continues.
Because of these factors and more, fMRI evidence has been excluded from any form of legal system. The testing is too uncontrolled and unpredictable. Therefore, it has been stated that fMRI has much more testing to do before it can be considered viable in the eyes of the legal system.
Criticism
Some scholars have criticized fMRI studies for problematic statistical analyses, often based on low-power, small-sample studies. Other fMRI researchers have defended their work as valid. In 2018, Turner and colleagues have suggested that the small sizes affect the replicability of task-based fMRI studies and claimed that even datasets with at least 100 participants the results may not be well replicated, although there are debates on it.
In one real but satirical fMRI study, a dead salmon was shown pictures of humans in different emotional states. The authors provided evidence, according to two different commonly used statistical tests, of areas in the salmon's brain suggesting meaningful activity. The study was used to highlight the need for more careful statistical analyses in fMRI research, given the large number of voxels in a typical fMRI scan and the multiple comparisons problem. Before the controversies were publicized in 2010, between 25 and 40% of studies on fMRI being published were not using the corrected comparisons. But by 2012, that number had dropped to 10%. Dr. Sally Satel, writing in Time, cautioned that while brain scans have scientific value, individual brain areas often serve multiple purposes and "reverse inferences" as commonly used in press reports carry a significant chance of drawing invalid conclusions. In 2015, it was discovered that a statistical bug was found in the fMRI computations which likely invalidated at least 40,000 fMRI studies preceding 2015, and researchers suggest that results prior to the bug fix cannot be relied upon. Furthermore, it was later shown that how one sets the parameters in the software determines the false positive rate. In other words, study outcome can be determined by changing software parameters.
In 2020 professor Ahmad Hariri, (Duke University) one of the first researchers to use fMRI, performed a largescale experiment that sought to test the reliability of fMRI on individual people. In the study, he copied protocols from 56 published papers in psychology that used fMRI. The results suggest that fMRI has poor reliability when it comes to individual cases, but good reliability when it comes to general human thought patterns.
A 2025 study published in Nature Neuroscience found that BOLD signals in fMRI did not consistently relate to changes in neuronal activity.