

Modifiable areal unit problem
Source of statistical bias
- 6 min read
- 3 chapters

Related on Lably
Through Statistical hypothesis test, Region and District
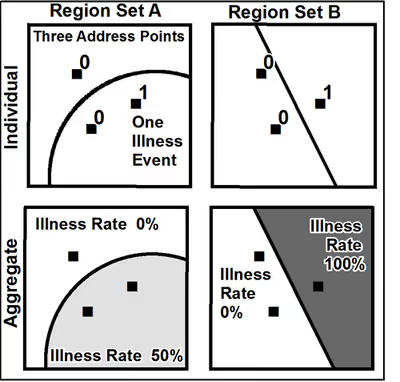
For example, census data may be aggregated into county districts, census tracts, postcode areas, police precincts, or any other arbitrary spatial partition. Thus, the results of data aggregation are dependent on the mapmaker's choice of which "modifiable areal unit" to use in their analysis. A census choropleth map calculating population density using state boundaries will yield radically different results from a map that calculates density based on county boundaries. Furthermore, census district boundaries are also subject to change over time, meaning the MAUP must be considered when comparing past to current data.
Background
This issue was first recognized by Gehlke and Biehl in 1934, and later described in detail in an entry in the Concepts and Techniques in Modern Geography (CATMOG) series by Stan Openshaw (1984) as well as in the book by Giuseppe Arbia (1988). In particular, Openshaw (1984) observed that "the areal units (zonal objects) used in many geographical studies are arbitrary, modifiable, and subject to the whims and fancies of whoever is doing, or did, the aggregating." The problem is especially apparent when the aggregate data are used for cluster analysis for spatial epidemiology, spatial statistics or choropleth mapping, in which misinterpretations can easily be made without realizing it. Many fields of science, especially human geography, are prone to disregard the MAUP when drawing inferences from statistics based on aggregated data. MAUP is closely related to the topic of ecological fallacy and ecological bias (Arbia, 1988). Stan Openshaw's work on this topic has led to Michael F. Goodchild suggesting it be referred to as the "Openshaw effect."
Ecological bias caused by MAUP has been documented as two separate effects that usually occur simultaneously during the analysis of aggregated data. First, the scale effect causes variation in statistical results between different levels of aggregation (radial distance). Therefore, the association between variables depends on the size of areal units for which data are reported. Generally, correlation increases as areal unit size increases. The zoning effect describes variation in correlation statistics caused by the regrouping of data into different configurations at the same scale (areal shape).
Since the 1930s, research has found extra variation in statistical results because of the MAUP. The standard methods of calculating within-group and between-group variance do not account for the extra variance seen in MAUP studies as the groupings change. The MAUP can be used as a methodology to calculate upper and lower limits as well as average regression parameters for multiple sets of spatial groupings. The MAUP is a critical source of error in spatial studies, whether observational or experimental. As such, unit consistency, particularly in a time-series cross-sectional (TSCS) context, is essential. Furthermore, robustness checks of unit sensitivity to alternative spatial aggregation should be routinely performed to mitigate associated biases on resulting statistical estimates.
Sign in to keep reading
2 more chapters are free with a Lably account.
Suggested solutions
Several suggestions have been made in the literature to reduce aggregation bias during regression analysis. A researcher might correct the variance-covariance matrix using samples from individual-level data. Alternatively, one might focus on local spatial regression rather than global regression. A researcher might also attempt to design areal units to maximize a particular statistical result. Others have argued that it may be difficult to construct a single set of optimal aggregation units for multiple variables, each of which may exhibit non-stationarity and spatial autocorrelation across space in different ways. Others have suggested developing statistics that change across scales in a predictable way, perhaps using fractal dimension as a scale-independent measure of spatial relationships. Others have suggested Bayesian hierarchical models as a general methodology for combining aggregated and individual-level data for ecological inference.
Studies of the MAUP based on empirical data can only provide limited insight due to an inability to control relationships between multiple spatial variables. Data simulation is necessary to have control over various properties of individual-level data. Simulation studies have demonstrated that the spatial support of variables can affect the magnitude of ecological bias caused by spatial data aggregation.
MAUP sensitivity analysis
Using simulations for univariate data, Larsen advocated the use of a Variance Ratio to investigate the effect of spatial configuration, spatial association, and data aggregation. A detailed description of the variation of statistics due to MAUP is presented by Reynolds, who demonstrates the importance of the spatial arrangement and spatial autocorrelation of data values. Reynold’s simulation experiments were expanded by Swift, who in which a series of nine exercises began with simulated regression analysis and spatial trend, then focused on the topic of MAUP in the context of spatial epidemiology. A method of MAUP sensitivity analysis is presented that demonstrates that the MAUP is not entirely a problem. MAUP can be used as an analytical tool to help understand spatial heterogeneity and spatial autocorrelation.
This topic is of particular importance because in some cases data aggregation can obscure a strong correlation between variables, making the relationship appear weak or even negative. Conversely, MAUP can cause random variables to appear as if there is a significant association where there is not. Multivariate regression parameters are more sensitive to MAUP than correlation coefficients. Until a more analytical solution to MAUP is discovered, spatial sensitivity analysis using a variety of areal units is recommended as a methodology to estimate the uncertainty of correlation and regression coefficients due to ecological bias. An example of data simulation and re-aggregation using the ArcPy library is available.
In transport planning, MAUP is associated to Traffic Analysis Zoning (TAZ). A major point of departure in understanding problems in transportation analysis is the recognition that spatial analysis has some limitations associated with the discretization of space. Among them, modifiable areal units and boundary problems are directly or indirectly related to transportation planning and analysis through the design of traffic analysis zones – most of transport studies require directly or indirectly the definition of TAZs. The modifiable boundary and the scale issues should all be given specific attention during the specification of a TAZ because of the effects these factors exert on statistical and mathematical properties of spatial patterns (ie the modifiable areal unit problem—MAUP). In the studies of Viegas, Martinez and Silva (2009, 2009b) the authors propose a method where the results obtained from the study of spatial data are not independent of the scale, and the aggregation effects are implicit in the choice of zonal boundaries. The delineation of zonal boundaries of TAZs has a direct impact on the reality and accuracy of the results obtained from transportation forecasting models. In this paper the MAUP effects on the TAZ definition and the transportation demand models are measured and analyzed using different grids (in size and in origin location). This analysis was developed by building an application integrated in commercial GIS software and by using a case study (Lisbon Metropolitan Area) to test its implementabiity and performance. The results reveal the conflict between statistical and geographic precision, and their relationship with the loss of information in the traffic assignment step of the transportation planning models.
Research has also identified the modifiable areal unit problem (MAUP) to be a factor in climate action and governance by affecting coordination between national and local actors. Data scaling issues associated with MAUP may result in mismatches in climate priorities and create inequities in the outcomes of climate action, potentially undermining the effectiveness of policies designed to address climate change at different governance levels.