

Receiver operating characteristic
Diagnostic plot of binary classifier ability
- 19 min read
- 11 chapters

Related on Lably
Through Graph of a function, Power (statistics) and Type I and type II errors
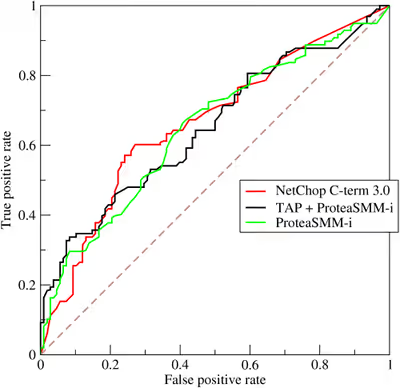
The ROC curve is the plot of the true positive rate (TPR) against the false positive rate (FPR) at each threshold setting.
The ROC can also be thought of as a plot of the statistical power as a function of the Type I Error of the decision rule (when the performance is calculated from just a sample of the population, it can be thought of as estimators of these quantities). The ROC curve is thus the sensitivity as a function of false positive rate.
Given that the probability distributions for both true positive and false positive are known, the ROC curve is obtained as the cumulative distribution function (CDF, area under the probability distribution from to the discrimination threshold) of the detection probability in the y-axis versus the CDF of the false positive probability on the x-axis.
ROC analysis provides tools to select possibly optimal models and to discard suboptimal ones independently from (and prior to specifying) the cost context or the class distribution. ROC analysis is related in a direct and natural way to the cost/benefit analysis of diagnostic decision making.
Terminology
The true-positive rate is also known as sensitivity or probability of detection. The false-positive rate is also known as the probability of false alarm and equals (1 − specificity). The ROC is also known as a relative operating characteristic curve, because it is a comparison of two operating characteristics (TPR and FPR) as the criterion changes.
Sign in to keep reading
10 more chapters are free with a Lably account.
History
The ROC curve was first developed by electrical engineers and radar engineers during World War II for detecting enemy objects in battlefields, starting in 1941, which led to its name ("receiver operating characteristic").
It was soon introduced to psychology to account for the perceptual detection of stimuli. ROC analysis has been used in medicine, radiology, biometrics, forecasting of natural hazards, meteorology, model performance assessment, and other areas for many decades and is increasingly used in machine learning and data mining research.
Basic concept
A classification model (classifier or diagnosis) is a mapping of instances between certain classes/groups. Because the classifier or diagnosis result can be an arbitrary real value (continuous output), the classifier boundary between classes must be determined by a threshold value (for instance, to determine whether a person has hypertension based on a blood pressure measure). Or it can be a discrete class label, indicating one of the classes.
Consider a two-class prediction problem (binary classification), in which the outcomes are labeled either as positive (p) or negative (n). There are four possible outcomes from a binary classifier. If the outcome from a prediction is p and the actual value is also p, then it is called a true positive (TP); however if the actual value is n then it is said to be a false positive (FP). Conversely, a true negative (TN) has occurred when both the prediction outcome and the actual value are n, and a false negative (FN) is when the prediction outcome is n while the actual value is p.
To get an appropriate example in a real-world problem, consider a diagnostic test that seeks to determine whether a person has a certain disease. A false positive in this case occurs when the person tests positive, but does not actually have the disease. A false negative, on the other hand, occurs when the person tests negative, suggesting they are healthy, when they actually do have the disease.
Consider an experiment from P positive instances and N negative instances for some condition. The four outcomes can be formulated in a 2×2 contingency table or confusion matrix, as follows:
ROC space
The contingency table can derive several evaluation "metrics" (see infobox). To draw a ROC curve, only the true positive rate (TPR) and false positive rate (FPR) are needed (as functions of some classifier parameter). The TPR defines how many correct positive results occur among all positive samples available during the test. FPR, on the other hand, defines how many incorrect positive results occur among all negative samples available during the test.
A ROC space is defined by FPR and TPR as x and y axes, respectively, which depicts relative trade-offs between true positive (benefits) and false positive (costs). Since TPR is equivalent to sensitivity and FPR is equal to 1 − specificity, the ROC graph is sometimes called the sensitivity vs (1 − specificity) plot. Each prediction result or instance of a confusion matrix represents one point in the ROC space.
The best possible prediction method would yield a point in the upper left corner or coordinate (0,1) of the ROC space, representing 100% sensitivity (no false negatives) and 100% specificity (no false positives). The (0,1) point is also called a perfect classification. A random guess would give a point along a diagonal line (the so-called line of no-discrimination) from the bottom left to the top right corners (regardless of the positive and negative base rates). An intuitive example of random guessing is a decision by flipping coins. As the size of the sample increases, a random classifier's ROC point tends towards the diagonal line. In the case of a balanced coin, it will tend to the point (0.5, 0.5).
The diagonal divides the ROC space. Points above the diagonal represent good classification results (better than random); points below the line represent bad results (worse than random). Note that the output of a consistently bad predictor could simply be inverted to obtain a good predictor.
Consider four prediction results from 100 positive and 100 negative instances:
Plots of the four results above in the ROC space are given in the figure. The result of method A clearly shows the best predictive power among A, B, and C. The result of B lies on the random guess line (the diagonal line), and it can be seen in the table that the accuracy of B is 50%. However, when C is mirrored across the center point (0.5,0.5), the resulting method C′ is even better than A. This mirrored method simply reverses the predictions of whatever method or test produced the C contingency table. Although the original C method has negative predictive power, simply reversing its decisions leads to a new predictive method C′ which has positive predictive power. When the C method predicts p or n, the C′ method would predict n or p, respectively. In this manner, the C′ test would perform the best. The closer a result from a contingency table is to the upper left corner, the better it predicts, but the distance from the random guess line in either direction is the best indicator of how much predictive power a method has. If the result is below the line (i.e. the method is worse than a random guess), all of the method's predictions must be reversed in order to utilize its power, thereby moving the result above the random guess line.
Curves in ROC space
In binary classification, the class prediction for each instance is often made based on a continuous random variable , which is a "score" computed for the instance (e.g. the estimated probability in logistic regression). Given a threshold parameter , the instance is classified as "positive" if , and "negative" otherwise. follows a probability density if the instance actually belongs to class "positive", and if otherwise. Therefore, the true positive rate is given by and the false positive rate is given by . The ROC curve plots parametrically versus with as the varying parameter.
For example, imagine that the blood protein levels in diseased people and healthy people are normally distributed with means of 2 g/dL and 1 g/dL respectively. A medical test might measure the level of a certain protein in a blood sample and classify any number above a certain threshold as indicating disease. The experimenter can adjust the threshold (green vertical line in the figure), which will in turn change the false positive rate. Increasing the threshold would result in fewer false positives (and more false negatives), corresponding to a leftward movement on the curve. The actual shape of the curve is determined by how much overlap the two distributions have.
Criticisms
Several studies criticize certain applications of the ROC curve and its area under the curve as measurements for assessing binary classifications when they do not capture the information relevant to the application.
The main criticism to the ROC curve described in these studies regards the incorporation of areas with low sensitivity and low specificity (both lower than 0.5) for the calculation of the total area under the curve (AUC)., as described in the plot on the right.
According to the authors of these studies, that portion of area under the curve (with low sensitivity and low specificity) regards confusion matrices where binary predictions obtain bad results, and therefore should not be included for the assessment of the overall performance. Moreover, that portion of AUC indicates a space with high or low confusion matrix threshold which is rarely of interest for scientists performing a binary classification in any field.
Another criticism to the ROC and its area under the curve is that they say nothing about precision and negative predictive value.
A high ROC AUC, such as 0.9 for example, might correspond to low values of precision and negative predictive value, such as 0.2 and 0.1 in the [0, 1] range. If one performed a binary classification, obtained an ROC AUC of 0.9 and decided to focus only on this metric, they might overoptimistically believe their binary test was excellent. However, if this person took a look at the values of precision and negative predictive value, they might discover their values are low.
The ROC AUC summarizes sensitivity and specificity, but does not inform regarding precision and negative predictive value.
Further interpretations
Sometimes, the ROC is used to generate a summary statistic. Common versions are:
- the intercept of the ROC curve with the line at 45 degrees orthogonal to the no-discrimination line - the balance point where Sensitivity = Specificity
- the intercept of the ROC curve with the tangent at 45 degrees parallel to the no-discrimination line that is closest to the error-free point (0,1) – also called Youden's J statistic and generalized as Informedness
- the area between the ROC curve and the no-discrimination line multiplied by two is called the Gini coefficient, especially in the context of credit scoring. It should not be confused with the measure of statistical dispersion also called Gini coefficient.
- the area between the full ROC curve and the triangular ROC curve including only (0,0), (1,1) and one selected operating point – Consistency
- the area under the ROC curve, or "AUC" ("area under curve"), or A' (pronounced "a-prime"), or "c-statistic" ("concordance statistic").
- the sensitivity index d′ (pronounced "d-prime"), the distance between the mean of the distribution of activity in the system under noise-alone conditions and its distribution under signal-alone conditions, divided by their standard deviation, under the assumption that both these distributions are normal with the same standard deviation. Under these assumptions, the shape of the ROC is entirely determined by d′.
However, any attempt to summarize the ROC curve into a single number loses information about the pattern of tradeoffs of the particular discriminator algorithm.
Probabilistic interpretation
The area under the curve (often referred to as simply the AUC) is equal to the probability that a classifier will rank a randomly chosen positive instance higher than a randomly chosen negative one (assuming 'positive' ranks higher than 'negative'). In other words, when given one randomly selected positive instance and one randomly selected negative instance, AUC is the probability that the classifier will be able to tell which one is which.
This can be seen as follows: the area under the curve is given by (the integral boundaries are reversed as large threshold has a lower value on the x-axis)
where is the score for a positive instance and is the score for a negative instance, and and are probability densities as defined in previous section.
If and follows two Gaussian distributions, then .
Area under the curve
It can be shown that the AUC is closely related to the Mann–Whitney U, which tests whether positives are ranked higher than negatives. For a predictor , an unbiased estimator of its AUC can be expressed by the following Wilcoxon-Mann-Whitney statistic:
where denotes an indicator function which returns 1 if otherwise return 0; is the set of negative examples, and is the set of positive examples.
In the context of credit scoring, a rescaled version of AUC is often used:
.
is referred to as Gini index or Gini coefficient, but it should not be confused with the measure of statistical dispersion that is also called Gini coefficient. is a special case of Somers' D.
It is also common to calculate the Area Under the ROC Convex Hull (ROC AUCH = ROCH AUC) as any point on the line segment between two prediction results can be achieved by randomly using one or the other system with probabilities proportional to the relative length of the opposite component of the segment. It is also possible to invert concavities – just as in the figure the worse solution can be reflected to become a better solution; concavities can be reflected in any line segment, but this more extreme form of fusion is much more likely to overfit the data.
The machine learning community most often uses the ROC AUC statistic for model comparison. This practice has been questioned because AUC estimates are quite noisy and suffer from other problems. Nonetheless, the coherence of AUC as a measure of aggregated classification performance has been vindicated, in terms of a uniform rate distribution, and AUC has been linked to a number of other performance metrics such as the Brier score.
Another problem with ROC AUC is that reducing the ROC Curve to a single number ignores the fact that it is about the tradeoffs between the different systems or performance points plotted and not the performance of an individual system, as well as ignoring the possibility of concavity repair, so that related alternative measures such as Informedness or DeltaP are recommended. These measures are essentially equivalent to the Gini for a single prediction point with DeltaP' = Informedness = 2AUC-1, whilst DeltaP = Markedness represents the dual (viz. predicting the prediction from the real class) and their geometric mean is the Matthews correlation coefficient.
Whereas ROC AUC varies between 0 and 1 — with an uninformative classifier yielding 0.5 — the alternative measures known as Informedness, Certainty and Gini Coefficient (in the single parameterization or single system case) all have the advantage that 0 represents chance performance whilst 1 represents perfect performance, and −1 represents the "perverse" case of full informedness always giving the wrong response. Bringing chance performance to 0 allows these alternative scales to be interpreted as Kappa statistics. Informedness has been shown to have desirable characteristics for Machine Learning versus other common definitions of Kappa such as Cohen Kappa and Fleiss Kappa.
Sometimes it can be more useful to look at a specific region of the ROC Curve rather than at the whole curve. It is possible to compute partial AUC. For example, one could focus on the region of the curve with low false positive rate, which is often of prime interest for population screening tests. Another common approach for classification problems in which P ≪ N (common in bioinformatics applications) is to use a logarithmic scale for the x-axis.
The ROC area under the curve is also called c-statistic or c statistic.
Other measures
The Total Operating Characteristic (TOC) also characterizes diagnostic ability while revealing more information than the ROC. For each threshold, ROC reveals two ratios, TP/(TP + FN) and FP/(FP + TN). In other words, ROC reveals and . On the other hand, TOC shows the total information in the contingency table for each threshold. The TOC method reveals all of the information that the ROC method provides, plus additional important information that ROC does not reveal, i.e. the size of every entry in the contingency table for each threshold. TOC also provides the popular AUC of the ROC.
These figures are the TOC and ROC curves using the same data and thresholds. Consider the point that corresponds to a threshold of 74. The TOC curve shows the number of hits, which is 3, and hence the number of misses, which is 7. Additionally, the TOC curve shows that the number of false alarms is 4 and the number of correct rejections is 16. At any given point in the ROC curve, it is possible to glean values for the ratios of and . For example, at threshold 74, it is evident that the x coordinate is 0.2 and the y coordinate is 0.3. However, these two values are insufficient to construct all entries of the underlying two-by-two contingency table.
Detection error tradeoff graph
An alternative to the ROC curve is the detection error tradeoff (DET) graph, which plots the false negative rate (missed detections) vs. the false positive rate (false alarms) on non-linearly transformed x- and y-axes. The transformation function is the quantile function of the normal distribution, i.e., the inverse of the cumulative normal distribution. It is, in fact, the same transformation as zROC, below, except that the complement of the hit rate, the miss rate or false negative rate, is used. This alternative spends more graph area on the region of interest. Most of the ROC area is of little interest; one primarily cares about the region tight against the y-axis and the top left corner – which, because of using miss rate instead of its complement, the hit rate, is the lower left corner in a DET plot. Furthermore, DET graphs have the useful property of linearity and a linear threshold behavior for normal distributions. The DET plot is used extensively in the automatic speaker recognition community, where the name DET was first used. The analysis of the ROC performance in graphs with this warping of the axes was used by psychologists in perception studies halfway through the 20th century, where this was dubbed "double probability paper".
Z-score
If a standard score is applied to the ROC curve, the curve will be transformed into a straight line. This z-score is based on a normal distribution with a mean of zero and a standard deviation of one. In memory strength theory, one must assume that the zROC is not only linear, but has a slope of 1.0. The normal distributions of targets (studied objects that the subjects need to recall) and lures (non studied objects that the subjects attempt to recall) is the factor causing the zROC to be linear.
The linearity of the zROC curve depends on the standard deviations of the target and lure strength distributions. If the standard deviations are equal, the slope will be 1.0. If the standard deviation of the target strength distribution is larger than the standard deviation of the lure strength distribution, then the slope will be smaller than 1.0. In most studies, it has been found that the zROC curve slopes constantly fall below 1, usually between 0.5 and 0.9. Many experiments yielded a zROC slope of 0.8. A slope of 0.8 implies that the variability of the target strength distribution is 25% larger than the variability of the lure strength distribution.
Another variable used is d' (d prime) (discussed above in "Other measures"), which can easily be expressed in terms of z-values. Although d' is a commonly used parameter, it must be recognized that it is only relevant when strictly adhering to the very strong assumptions of strength theory made above.
The z-score of an ROC curve is always linear, as assumed, except in special situations. The Yonelinas familiarity-recollection model is a two-dimensional account of recognition memory. Instead of the subject simply answering yes or no to a specific input, the subject gives the input a feeling of familiarity, which operates like the original ROC curve. What changes, though, is a parameter for Recollection (R). Recollection is assumed to be all-or-none, and it trumps familiarity. If there were no recollection component, zROC would have a predicted slope of 1. However, when adding the recollection component, the zROC curve will be concave up, with a decreased slope. This difference in shape and slope result from an added element of variability due to some items being recollected. Patients with anterograde amnesia are unable to recollect, so their Yonelinas zROC curve would have a slope close to 1.0.
History
The ROC curve was first used during World War II for the analysis of radar signals before it was employed in signal detection theory. Following the attack on Pearl Harbor in 1941, the United States military began new research to increase the prediction of correctly detected Japanese aircraft from their radar signals. For these purposes they measured the ability of a radar receiver operator to make these important distinctions, which was called the Receiver Operating Characteristic.
In the 1950s, ROC curves were employed in psychophysics to assess human (and occasionally non-human animal) detection of weak signals. In medicine, ROC analysis has been extensively used in the evaluation of diagnostic tests. ROC curves are also used extensively in epidemiology and medical research and are frequently mentioned in conjunction with evidence-based medicine. In radiology, ROC analysis is a common technique to evaluate new radiology techniques. In the social sciences, ROC analysis is often called the ROC Accuracy Ratio, a common technique for judging the accuracy of default probability models. ROC curves are widely used in laboratory medicine to assess the diagnostic accuracy of a test, to choose the optimal cut-off of a test and to compare diagnostic accuracy of several tests.
ROC curves also proved useful for the evaluation of machine learning techniques. The first application of ROC in machine learning was by Spackman who demonstrated the value of ROC curves in comparing and evaluating different classification algorithms.
ROC curves are also used in verification of forecasts in meteorology.
Radar in detail
As mentioned ROC curves are critical to radar operation and theory. The signals received at a receiver station, as reflected by a target, are often of very low energy, in comparison to the noise floor. The ratio of signal to noise is an important metric when determining if a target will be detected. This signal to noise ratio is directly correlated to the receiver operating characteristics of the whole radar system, which is used to quantify the ability of a radar system.
Consider the development of a radar system. A specification for the abilities of the system may be provided in terms of probability of detect, , with a certain tolerance for false alarms, . A simplified approximation of the required signal to noise ratio at the receiver station can be calculated by solving
for the signal to noise ratio . Here, is not in decibels, as is common in many radar applications. Conversion to decibels is through . From this figure, the common entries in the radar range equation (with noise factors) may be solved, to estimate the required effective radiated power.
ROC curves beyond binary classification
The extension of ROC curves for classification problems with more than two classes is cumbersome. Two common approaches for when there are multiple classes are (1) average over all pairwise AUC values and (2) compute the volume under surface (VUS). To average over all pairwise classes, one computes the AUC for each pair of classes, using only the examples from those two classes as if there were no other classes, and then averages these AUC values over all possible pairs. When there are c classes there will be c(c − 1) / 2 possible pairs of classes.
The volume under surface approach has one plot a hypersurface rather than a curve and then measure the hypervolume under that hypersurface. Every possible decision rule that one might use for a classifier for c classes can be described in terms of its true positive rates (TPR1, . . . , TPRc). It is this set of rates that defines a point, and the set of all possible decision rules yields a cloud of points that define the hypersurface. With this definition, the VUS is the probability that the classifier will be able to correctly label all c examples when it is given a set that has one randomly selected example from each class. The implementation of a classifier that knows that its input set consists of one example from each class might first compute a goodness-of-fit score for each of the c2 possible pairings of an example to a class, and then employ the Hungarian algorithm to maximize the sum of the c selected scores over all c! possible ways to assign exactly one example to each class.
Given the success of ROC curves for the assessment of classification models, the extension of ROC curves for other supervised tasks has also been investigated. Notable proposals for regression problems are the so-called regression error characteristic (REC) Curves and the Regression ROC (RROC) curves. In the latter, RROC curves become extremely similar to ROC curves for classification, with the notions of asymmetry, dominance and convex hull. Also, the area under RROC curves is proportional to the error variance of the regression model.