


Related on Lably
Through Atmospheric pressure, China and El Niño–Southern Oscillation
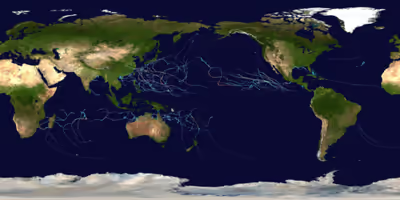
Tropical cyclones are primarily monitored by 10 warning centers around the world, which are designated as a Regional Specialized Meteorological Center (RSMC) or a Tropical Cyclone Warning Center (TCWC) by the World Meteorological Organization (WMO). These centers are: National Hurricane Center (NHC), Central Pacific Hurricane Center (CPHC), Japan Meteorological Agency (JMA), Indian Meteorological Department (IMD), Météo-France (MFR), Indonesia's Meteorology, Climatology, and Geophysical Agency (BMKG), Australian Bureau of Meteorology (BoM), Papua New Guinea's National Weather Service (PNGNWS), Fiji Meteorological Service (FMS), and New Zealand's MetService. Unofficial, but still notable, warning centers include the Philippine Atmospheric, Geophysical and Astronomical Services Administration (PAGASA; albeit official within the Philippines), the United States's Joint Typhoon Warning Center (JTWC), and the Brazilian Navy Hydrographic Center.
Global atmospheric and hydrologic conditions
Global tropical cyclone activity during 2026 was shaped by a transition in the El Niño–Southern Oscillation (ENSO) phase. The year opened under weak-to-neutral La Niña conditions continuing from late 2025, which contributed to heightened tropical cyclone activity across the Southern Hemisphere basins—including the South-West Indian Ocean and Australian region—during January and February.
By mid-2026, sea surface temperature (SST) anomalies across the central and eastern equatorial Pacific indicated a rapid transition toward El Niño conditions. This warming trend suppressed early-season activity in the Atlantic basin, where high vertical wind shear led to a slow start with only two named tropical storms (Arthur and Bertha) forming through July. Conversely, the warming equatorial Pacific enhanced environmental conditions in the Eastern and Central Pacific and the Western Pacific, supporting rapid intensification events such as Super Typhoon Sinlaku in April and Major Hurricane Genevieve in July.
Sustained marine heatwaves across the Northern Hemisphere during the northern summer contributed to well-above-average sea surface temperatures in the Western Pacific and Northern Indian Ocean, fueling early basin activity and high accumulated cyclone energy (ACE) totals relative to long-term averages by midyear.
Sign in to keep reading
3 more chapters are free with a Lably account.
Summary
North Atlantic Ocean
On June 17, Tropical Storm Arthur formed in the northwestern Gulf of Mexico after emerging off the Texas coastline. On July 19, Tropical Depression Two formed in the northeastern Gulf of Mexico. On July 20, the storm became Tropical Storm Bertha. It would then make landfall in St. Bernard Parish on July 22 and again near Lake Charles, Louisiana on July 23 before dissipating over Texas. Quiet conditions resumed until August 12, when Tropical Storm Cristobal formed well east-northeast of Bermuda. Once again, a period of calm would occur until August 27, when an area of low pressure became designated as Tropical Storm Dolly. The name was a coincidence with the passing of Dolly Parton. Due to high shear, the storm dissipated over the Lesser Antilles and brought heavy rains to the area. The unseasonable quiet remained until the end of the month, when Tropical Storm Edouard developed in the Gulf and made landfall in Louisiana before causing tremendous flooding in the region. On September 19, Tropical Storm Fay developed in the subtropical North Atlantic; despite briefly approaching hurricane intensity, strong wind shear rapidly degraded the system. On September 24, a weak tropical depression formed near the Cabo Verde Islands and was designated Tropical Storm Gonzalo the following day.
Eastern and Central Pacific Oceans
Tropical Depression One-E formed in the open Pacific on June 2, eventually strengthening into Tropical Storm Amanda the following day. Tropical Depression Two-E formed near Mexico on June 7, rapidly approaching towards it. It intensified into a tropical storm and got named Boris. Tropical Depression Three-E formed near Central America on June 8, intensifying into a tropical storm and being named Cristina shortly after. Boris affected southern Mexico while Cristina dumped torrential rain in Central America. On July 1, a disturbance in the Pacific developed into Tropical Storm Douglas and would meander around before dissipating by July 3. On July 14, another storm formed and was named Tropical Storm Elida, would impact Clarion Island, before it would degenerate into a remnant low on July 20. On July 19, Hurricane Fausto formed, becoming the first hurricane of the season a day later. Hurricane Genevieve formed soon after on July 24. It later became the first category 5 hurricane of the season. On August 13, tropical storms Hernan and Lala formed, the latter of which being the first storm of the season to form within the Central Pacific basin. Lala later rapidly intensified and became a category 4 major hurricane after affecting Hawaii. Tropical Storm Moke formed after the rapid intensification of Lala.
Activity escalated further into September, driven by exceptionally high sea surface temperatures from an intensifying El Niño. On September 20, Hurricane Odalys and Hurricane Polo formed off the Pacific coast of Mexico , the latter underwent explosive rapid intensification, adding 110 mph (180 km/h) to its wind speeds over a 24-hour period. Polo peaked as a Category 5 major hurricane on September 22 with maximum sustained winds of 180 mph (290 km/h) and a minimum central pressure of 892 mb (26.34 inHg). This made Polo the second-most intense Pacific hurricane on record by central pressure, behind only Hurricane Patricia in 2015. Concurrently, Tropical Storm Nolo formed south of Hawaii on September 24, bringing threat of localized flooding to the Hawaiian Islands.
Western Pacific Ocean
A tropical depression formed east of the Philippines on 13 January, marking the start of the season. The depression was subsequently named Ada by PAGASA and later Nokaen by the JMA respectively on January 14 and 15, marking it the earliest start to a season since 2019. A tropical depression formed near Guam on February 3, it later entered the PAR and was named Basyang, it was named Penha the following day. Tropical Storm Nuri formed northeast of Yap on March 10. Tropical Storm Sinlaku formed west of Pohnpei on April 8, later intensified into a typhoon on April 10 and was recognised as a super typhoon on April 12, it later reached a peak of 115 knots (215 km/h) and 905 mb (26.72 inHg). Tropical Storm Hagupit formed near Chuuk on May 5, it entered the PAR on May 9, gaining the name Caloy. Tropical Storm Jangmi formed on May 26 and entered the PAR on May 28, gaining the name Domeng, it slowly intensified into a category 1 typhoon on May 30 before making landfall in Wakayama on June 3. A tropical depression formed on June 3, it entered the PAR on June 4, gaining the name Ester, a few hours later, JTWC classified it as a subtropical depression before making landfall in Taiwan. On June 18, Tropical Storm Mekkhala formed south of the Mariana Islands, it rapidly intensified into a Category 4 typhoon on June 22. Tropical Storm Higos formed the same day.
Activity accelerated sharply in July with Maysak forming on July 1, tracking across Hainan Island and northern Vietnam before dumping catastrophic rainfall over southwestern China that caused US$3.28 billion in damages and 39 fatalities. Immediately following, Bavi developed on July 4, passing very near Rota and the Mariana Islands with destructive winds and flooding. After tracking over the islands, Bavi caused 26 deaths in the Philippines, before hitting Zhejiang, China, on July 11.
Mid-to-late summer saw additional moderate and weak systems, including Tropical Storm Haishen, Typhoon Noul, Typhoon Dolphin, and a cluster of weaker systems including Tropical Storm Kujira, Severe Tropical Storm Chan-hom, Tropical Storm Peilou, and Tropical Storm Nangka. By late August and September, monsoonal activity fueled several short-lived systems across the South China Sea and Philippine Sea, including Typhoon Saudel, Tropical Storm Narra, Tropical Storm Gaenari, Tropical Storm Atsani, Typhoon Bang-Lang, Tropical Storm Etau, and Tropical Storm Krovanh (locally named "Pilandok"), the latter of which enhanced monsoon rainfall and caused widespread flooding across the central Philippines.
This stretch of minor activity culminated in late September with the development of Typhoon Dujuan. Forming east of the Philippines on 19 September, Dujuan rapidly organized as it tracked north-northwestward along Japan's eastern Pacific coastline on September 21–22. The massive system brought record-breaking rainfall across the Kanto region and the Izu Islands, including a September-record 600 mm (23.6 in) of rain within 24 hours on Oshima, prompting a Level 5 landslide special warning from the Japan Meteorological Agency. Dujuan's torrential rainfall and powerful wind gusts up to 144 km/h (90 mph) caused devastating landslides and urban flooding across Chiba and Kanagawa prefectures, resulting in at least four confirmed fatalities, several missing persons, power outages for over 9,000 households, and widespread grounding of transportation networks during Japan's Silver Week holidays. Following Dujuan's passage, the weak Tropical Storm Surigae (Queenie) formed over the Philippine Sea on 24 September.
North Indian Ocean
On 7 January, BOB 01 formed in the Bay of Bengal. After six months of inactivity, on 5 July, BOB 02 formed and struck Odisha. BOB 03 formed on 26 July, causing mass flooding in Odisha as it made landfall. BOB 04 formed southeast of Kolkata on 13 August, dissipating the following day. On 17 August, BOB 05 formed inland over West Bengal, dissipating 2 days later near North Jharkhand. Activity resumed in late September as a well-marked low-pressure system over the Bay of Bengal organized into Depression BOB 06 on 21 September. Moving west-northwestward under the influence of the regional monsoon trough, the storm intensified into a Deep Depression on 22 September. BOB 06 made landfall near Kalingapatnam, along the north Andhra Pradesh and south Odisha coastline, late on 23 September with peak sustained winds of 55–65 km/h (35–40 mph). The storm brought widespread heavy rainfall, urban inundation, and squally winds across coastal Andhra Pradesh, Odisha, and Telangana as it moved inland and steadily weakened through 25 September.
Mediterranean Sea
A European windstorm named Samuel, known as Jolina in Germany, transitioned into a subtropical cyclone over the south-central Mediterranean sea. It moved inland over Libya on 18 March, where one person died attempting to rescue people from floodwaters.
South-West Indian Ocean
January - June
The first cyclone of the year for this basin was Grant, which entered the basin on December 27 and rapidly intensified into an Intense Tropical Cyclone, and persisted into the new year. In mid-January, Dudzai formed and rapidly intensified into an Intense Tropical Cyclone. Ewetse formed and made landfall in Madagascar the following day. Zone of Disturbed Weather 08 formed on February 27. Fytia formed in the Mozambique Channel and intensified into a tropical cyclone on January 30. Gezani soon formed two days after Fytia dissipated. Horacio formed less than one day after Gezani turned post-tropical. Horacio strengthened to category 5 strength on the Saffir-Simpson Hurricane Wind Scale on 24 February, making it the first tropical cyclone to have reached that intensity this year. Tropical Depression 12 formed on March 12 and Cyclone Indusa formed on April 1. An extratropical cyclone formed on April 26, it later developed subtropical characteristics, and was named Juluka the following day.
Australian Region
January - June
07U formed in the Arafura Sea on December 14, and it didn’t dissipate until January 1. Iggy formed near Indonesia on December 29. Jenna followed suit on 3 January, and Koji formed off the northeast Queensland coast on 10 January. After developing in the Coral Sea and reaching Category 2 intensity, Tropical Cyclone Koji weakened to a tropical low before making landfall between Ayr and Bowen, Queensland, on the morning of 11 January, 2026, where it delivered life-threatening rainfall and flash flooding. Tropical Cyclone Luana formed from Koji’s remnants on January 18, and Mitchell formed on 6 February. Tropical Low 23U formed on February 11, 26U formed on February 24. Tropical Lows 30U, 28U, 31U and 29U formed on March 1 and 2, and Cyclone Narelle formed March 17. A week after Narelle became extratropical, Cyclone Maila formed. It was the first tropical cyclone in TCWC Port Moresby’s area of responsibility since Cyclone Guba in 2007.
South Pacific Ocean
January - June
Tropical Disturbance 04F persisted from last year, Tropical Low 14U did a crossover and got renumbered as 05F in January 19, shortly after it became post-tropical and left 10 dead. Tropical Depression 06F formed shorlly after, dissipating rapidly. Tropical Disturbance 07F following the peak activity got noted, Tropical Disturbance 09F developed at February 26 after nearly a month of inactivity, the Fiji Meteorological Service named it Urmil, strong winds associated with the storm made a child drown in Namoli at Kaleli Settlement. Tropical Disturbance 10F formed on March 21, then it was last noted by the FMS at March 24. On April 3 a westerly wind burst formed an disturbance marked as 11F by the FMS, 2 days later, it was named Vaianu, it made a landfall in New Zealand, causing $1.5 million dollars of damage and was the last system of the season.
South Atlantic Ocean
On February 28, a subtropical depression was noted off the coast of the State of Rio De Janeiro in the South Atlantic. A second subtropical depression was noted to its north two days later, the depression promptly intensified into a subtropical storm, receiving the name Caiobá, they simultaneously existed till March 3, where both systems were last noted by the Brazilian Navy on their Surface weather analysis. This is the first officially recorded occasion in which multiple subtropical cyclones co-existed in the South Atlantic.
Systems
January
January was an unusually active month, with sixteen tropical cyclones forming and seven of them being named, the highest number since 2021. Out of the seven, Dudzai is the strongest cyclone of the month. Two cyclones, Grant and Iggy, persisted from the previous year into the current year. In the Northern Indian Ocean, BOB 01 formed on January 7, making it one of the earliest depressions ever recorded in the basin. Also, the Western Pacific season began with the formation of Tropical Storm Nokaen (locally known as Ada in the Philippines), which was named on January 15, although it originally formed two days earlier as a tropical depression. Nokaen became the first tropical cyclone to form in the Western Pacific in January since Tropical Storm Pabuk in 2019. In the Southwestern Indian Ocean, Cyclones Dudzai, Ewetse and Fytia formed, with the latter two affecting Madagascar and the former, Dudzai, intensifying into the month’s strongest system. To add on, Fytia rapidly intensified into a Category 3-equivalent cyclone in the Mozambique Channel before making landfall in Madagascar, causing 12 deaths in the country. In the Australian region, Cyclone Mitchell formed from a meandering tropical low. It then rapidly intensified into a Category 3-equivalent cyclone on the Australian scale.
February
February was below average in activity, however, it spawned several powerful tropical cyclones, including Horacio, which rapidly intensified into a Category 5 tropical cyclone and became the strongest tropical cyclone of the month; additionally, it is also the first tropical cyclone to do so this year. Eight tropical cyclones have formed this month, with five of them being named. February started with Cyclone Fytia and Cyclone Mitchell persisting from the previous month into this month. The series of early-season systems of the Western Pacific continued with Basyang, which formed near Yap on February 2. It was later named Penha two days later, becoming the first tropical cyclone to form in the month of February since Tropical Storm Dujuan in 2021. Penha went on to make landfall in Bayabas, Surigao del Sur on February 5 and was followed by multiple landfalls in Visayas the next day. Afterwards, land interaction and hostile conditions caused the storm to degenerate into a tropical depression. On February 10, Gezani caused over 63 deaths in Madagascar. On February 24, Horacio rapidly intensified into a Category 5 tropical cyclone. In the South Pacific basin, Urmil developed on February 27, becoming the latest-forming first-named tropical cyclone of the season within that basin, breaking the record set by Cyclone Bart during the 2016–17 season. On February 28, a Subtropical Depression formed off the coast of the State of Rio De Janeiro in the South Atlantic.
March
March was slightly inactive, featuring ten storms, four of which were named. Out of the four, Narelle was the strongest storm of the month. It started with the dissipation of Cyclone Urmil, a subtropical depression, and Tropical Low 26U persisting from the previous month into this month. Subtropical Storm Caiobá soon followed suit in the South Atlantic, coexisting with the previously mentioned subtropical depression, the first time in recorded history where two simultaneous subtropical cyclones existed in the South Atlantic. Meanwhile in the Western Pacific Basin, Tropical Storm Nuri and a Tropical Depression formed northeast of Yap on 10 March, continuing the early-season activity. On 15 March, Cyclone Narelle formed off the Australian coast, and then rapidly intensified upon its formation and naming, eventually becoming the strongest cyclone in the basin since Cyclone Ilsa in 2023. Narelle would later cross Australia and reach secondary peak as a Category 4. On 17 March, a European windstorm named Samuel, or Jolina in Germany, transitioned into a Mediterranean tropical-like cyclone before making landfall in Libya early the next day.
April
April was above-average, the most active since 2022. The month saw six cyclones forming, five of them being named, with Sinlaku being the strongest and the strongest of the year until Hurricane Polo in September by central pressure. Three tropical cyclones formed within the first three days of the month: those being Indusa in the South-West Indian basin, Maila in the Australian region, and Vaianu in the South Pacific. Indusa formed on the first day and was upgraded to a tropical cyclone on 3 April; two days later, it transitioned into a post-tropical cyclone. Maila formed a day after Indusa and became a very rare system, having been named by Port Moresby on 4 April, the first to do so since Cyclone Guba just nearly nineteen years ago. Vaianu formed and rapidly intensified into a severe tropical cyclone, the first in the basin since Cyclone Mal in 2023, ending the longest streak of seasons without a severe tropical cyclone of such intensity in the satellite era. On April 8th, a tropical depression formed off Pohnpei which became Typhoon Sinlaku, therefore continuing 2026's streak of early-season cyclone activity in the Western Pacific. From April 13-16th, Tropical Low 38U existed in the far eastern Indian Ocean in the Australian region without developing into a full-fledged tropical cyclone. On April 26th, a subtropical depression formed south of Madagascar, becoming Subtropical Storm Juluka the following day.
May
May was significantly below-average, the least active since 2016. Three tropical cyclones formed, and two of them were named. All of them formed in the Western Pacific basin. Tropical Storm Hagupit formed in the early part of the month, and proceeded to exist as a tropical cyclone for ten days, albeit its intensity remained weak throughout its lifetime. Hagupit caused minimal damage in the Caroline Islands. A short-lived tropical depression briefly accompanied Hagupit a few days after its formation. Severe Tropical Storm Jangmi formed in late May, and went on to become a broad system with a very large circulation, persisting into June. Jangmi affected the Japanese Islands as June began.
June
June was a rather active month, with nine cyclones forming within the month. Seven were officially named, excluding one system that is deemed unofficially named outside the Philippines, that being Tropical Depression Ester. The month of June began with Jangmi, a severe tropical storm persisting from the previous month into the current month. On June 2, Tropical Storm Amanda formed in the Eastern Pacific, becoming the first tropical cyclone of the 2026 Pacific hurricane season. The following day, a tropical depression developed in the South China Sea in the Western Pacific basin, being named Ester by the Philippines. Meanwhile in the Eastern Pacific, Tropical Storm Boris affected southern Mexico while Tropical Storm Cristina dumped heavy rain across Central America. On June 9, a tropical depression formed in a similar area to where Ester formed, affecting similar areas and taking the same general trajectory as the aforementioned system. On June 17, Tropical Storm Arthur formed in the Gulf of Mexico after emerging off the coast of Texas, becoming the first named storm of the 2026 Atlantic hurricane season. The following day, Tropical Storm Mekkhala formed south of the Mariana Islands, due to very favourable conditions, Mekkhala rapidly intensified into a typhoon on June 21. Early the next day, Tropical Storm Higos formed to the west of the Mariana Islands. On the final day of the month, a tropical depression formed northwest of the Marshall Islands, and would go on to become Typhoon Bavi in July.
July
July was fairly active and very intense, especially towards the end of the month, with thirteen cyclones forming during the month, and nine of them being officially named. One cyclone from the previous month, Typhoon Bavi, persisted into this month after forming on the last day of June. Tropical storms Maysak and Douglas formed on July 1, in the Western Pacific and Eastern Pacific basins respectively. Maysak affected the Philippines and South China, while Douglas remained out to sea. After six months of inactivity in the North Indian Ocean, BOB 02 formed on July 5, quickly making landfall in Odisha. Tropical Storm Haishen formed on July 12 in the open Western Pacific, quickly dissipating within 2 days. On July 14, Tropical Storm Elida formed in the Eastern Pacific. On July 16, another tropical depression formed in the open Western Pacific, within close proximity of the equator. On July 19, Hurricane Fausto formed in the Eastern Pacific, while Tropical Storm Bertha formed in the eastern Gulf of Mexico. On July 22, Typhoon Noul formed near Yap. Hurricane Genevieve formed and rapidly intensified into a category 5 major hurricane. BOB 03 and Typhoon Dolphin formed on July 26, BOB 03 went on to make landfall in Digha and Typhoon Dolphin intensified into a category 5 super typhoon. On the final day of the month, a tropical depression formed east of the Philippines, which later became Tropical Storm Kujira.
August
August was extremely active, the most active since 2016. The month saw twenty-five cyclones form, twenty of them being named, with Hurricane Lowell being the strongest of the month. The month started with three systems persisting from last month, Genevieve, Dolphin and Kujira. Twenty-five systems and twenty named storms have formed in August, starting with Tropical Storm Chan-hom which formed near Wake Island on August 5. On August 8, Tropical Storm Peilou formed from the remnants of Kujira, and Tropical Depression 15W formed the following day. On August 11, Tropical Storm Nangka formed in the open western Pacific. Three systems formed on August 13, those being a tropical depression in the western Pacific, and tropical storms Hernan and Lala in the eastern and central Pacific basins. On August 15, another tropical depression formed in the western Pacific, which was named Saudel shortly after, before another depression named 18W formed near Taiwan in August 17. Narra formed as a tropical storm while on Gulf of Tonkin. Tropical storm Gaenari (known in the Philippines as Neneng) formed on August 18, before damaging Taiwan and China. On August 20, Tropical Depression two-C formed east-southeast of Hawaii, being named Moke on August 21. Tropical Depression Atsani formed on August 22, southwest of Saudel. Tropical depression nine-E formed on August 23, quickly being named Iselle on the same day, at the same time tropical depression ten-E formed the same day before named Julio at August 24, Iselle and Julio experienced Fujiwhara effect, eventually with Julio being fully consumed by Iselle on August 25. Tropical Depressions 20W and 21W formed on August 25 and 26, later named Bang-Lang and Etau being only about 500mi (800km) away from each other when formed, with their closest approach being 195mi (310km), resulting second Fujiwhara effect of the month, leading these two systems to move north. Tropical Depression four-E formed on August 27, named Dolly the same day. On August 27, Hurricane Karina formed and rapidly intensified into a Category 4 Major on August 30, before becoming a post-tropical cyclone on September 7. Hurricane Lowell formed on August 27 as well as Hurricane Karina, before rapidly intensifying into a Category 4 on September 1, before becoming a Category 5 twice on September 2, 5, later drifting north and impacting West of Hawaii. Krovanh (known in Philippines as Pilandok) formed on August 29, impacting Japan. Tropical Storm Edouard formed on August 31 as a Depression, becoming a Storm the same day, impacting Texas on September 1.
September
September was rather below average, but featured several strong storms, most notably Hurricane Polo from the Eastern Pacific. The month saw eighteen systems form, of which twelve have been named. The month started off with five storms persisting into the current month, Karina and Lowell from the Eastern Pacific, Saudel and Krovanh from the Western Pacific, and Edouard from the North Atlantic. Hurricane Marie kicked off the month as it formed to the southwest of Mexico on September 1. Two days later, Tropical Depression 23W formed west of the Mariana Islands. On September 9, Tropical Storm Norbert formed south of Mexico. A tropical depression developed in the South China Sea near Vietnam on September 11, and Tropical Depression Fifteen-E formed on September 13 named Nolo later on September 23, following Norbert's footsteps. Tropical Storm Dujuan formed between Micronesia and Guam that same day. On September 19, Tropical Storm Fay formed south-southwest of the Azores. Odalys formed on September 20. Hurricane Polo formed on 20 September, and rapidly intensified into a category 5, one of the most rapid intensifications documented worldwide, becoming the second-most intense hurricane in Eastern Pacific basins by central pressure. Surigae formed on September 21, before an unnamed depression formed. On September 24, another unnamed depression formed, before the next day, when Gonzalo formed.
October
Global effects
There are a total of seven tropical cyclone basins that tropical cyclones typically form in. In this table, data from all these basins are added.