


Learn it on Lably
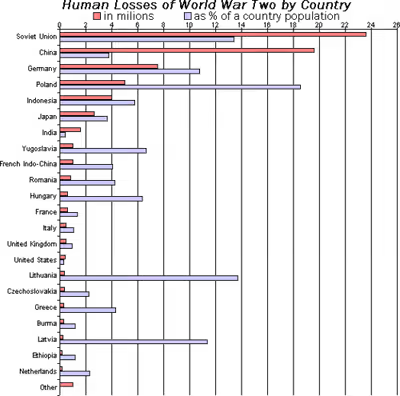
A bar graph shows comparisons among discrete categories. One axis of the chart shows the specific categories being compared, and the other axis represents a measured value. Some bar graphs present bars clustered or stacked in groups of more than one, showing the values of more than one measured variable.
History
Many sources consider William Playfair (1759–1824) to have invented the bar chart and the Exports and Imports of Scotland to and from different parts for one Year from Christmas 1780 to Christmas 1781 graph from his The Commercial and Political Atlas to be the first bar chart in history. Diagrams of the velocity of a constantly accelerating object against time published in The Latitude of Forms (attributed to Jacobus de Sancto Martino or, perhaps, to Nicole Oresme) about 300 years before can be interpreted as "proto bar charts".
Sign in to keep reading
One more chapter is free with a Lably account.
Usage
Bar graphs/charts provide a visual presentation of categorical data. Categorical data is a grouping of data into discrete groups, such as months of the year, age group, shoe sizes, and animals. These categories are usually qualitative. In a column (vertical) bar chart, categories appear along the horizontal axis and the height of the bar corresponds to the value of each category.
Bar charts have a discrete domain of categories, and are usually scaled so that all the data can fit on the chart. When there is no natural ordering of the categories being compared, bars on the chart may be arranged in any order. Bar charts arranged from highest to lowest incidence are called Pareto charts.
In many cases it is considered correct to use zero as the value at the end of each bar opposite to the end that indicates the data value, because using a non-zero value can make values that are relatively similar have deceptively different bar lengths. However, sometimes this approach is not appropriate or not feasible, such as with temperatures in Celsius or Fahrenheit where zero is a somewhat arbitrary value, and with logarithmic charts where "log(0)" would be infinitely far away.
Grouped (clustered) and stacked
Bar graphs can also be used for more complex comparisons of data with grouped (or "clustered") bar charts, and stacked bar charts.
In grouped (clustered) bar charts, for each categorical group there are two or more bars color-coded to represent a particular grouping. For example, a business owner with two stores might make a grouped bar chart with different colored bars to represent each store: the horizontal axis would show the months of the year and the vertical axis would show revenue.
Alternatively, Stacked bar charts (also known as Composite bar charts) stack bars on top of each other so that the height of the resulting stack shows the combined result. Unlike a grouped bar chart where each factor is displayed next to another, each with their own bar, the stacked bar chart displays multiple data points stacked in a single row or column. This may, for instance, take the form of uniform height bars charting a time series with internal stacked colours indicating the percentage participation of a sub-type of data. Another example would be a time series displaying total numbers, with internal colors indicating participation in the total by sub-types. Stacked bar charts are not suited to data sets having both positive and negative values.
Grouped bar charts usually present the information in the same order in each grouping. Stacked bar charts present the information in the same sequence on each bar.
Variable-width (variwide)
Variable-width bar charts, sometimes abbreviated variwide (bar) charts, are bar charts having bars with non-uniform widths. Generally:
- Bars represent quantities with respective rectangles of areas A that are respective arithmetic products of related pairs of
- vertical-axis quantities (A/X) and
- horizontal-axis quantities (X).
- Arithmetically, the area of each bar (rectangle) is determined a product of sides' lengths:
(A/X)*X= Area A for each bar
Roles of the vertical and horizontal axes may be reversed, depending on the desired application.
Examples of variable-width bar charts are shown at Wikimedia Commons.