

Time series
Sequence of data points over time
- 17 min read
- 7 chapters
- 1 lab on Lably

Learn it on Lably
A time series is often visualized using a run chart (a type of temporal line chart), which helps identify patterns such as trends, seasonal effects, and irregular fluctuations. Time series are widely used in statistics, actuarial science, signal processing, pattern recognition, econometrics, mathematical finance, weather forecasting, earthquake prediction, electroencephalography, control engineering, astronomy, communications engineering, and many other areas of applied science and engineering that involve temporal measurements.
Time series analysis comprises methods for analyzing time series data in order to extract meaningful statistics and other characteristics of the data. Time series forecasting is the use of a model to predict future values based on previously observed values. Generally, time series data is modeled as a stochastic process. While regression analysis is often employed in such a way as to test relationships between one or more different time series, this type of analysis is not usually called "time series analysis", which refers in particular to relationships between different points in time within a single series.
Time series data have a natural temporal ordering. This makes time series analysis distinct from cross-sectional studies, in which there is no natural ordering of the observations (e.g. explaining people's wages by reference to their respective education levels, where the individuals' data could be entered in any order). Time series analysis is also distinct from spatial data analysis where the observations typically relate to geographical locations (e.g. accounting for house prices by the location as well as the intrinsic characteristics of the houses). A stochastic model for a time series will generally reflect the fact that observations close together in time will be more closely related than observations further apart. In addition, time series models will often make use of the natural one-way ordering of time so that values for a given period will be expressed as deriving in some way from past values, rather than from future values (see time reversibility).
Time series analysis can be applied to real-valued, continuous data, discrete numeric data, or discrete symbolic data (i.e. sequences of characters, such as letters and words in the English language).
Methods for analysis
Methods for time series analysis may be divided into two classes: frequency-domain methods and time-domain methods. The former include spectral analysis and wavelet analysis; the latter include auto-correlation and cross-correlation analysis. In the time domain, correlation and analysis can be made in a filter-like manner using scaled correlation, thereby mitigating the need to operate in the frequency domain.
Additionally, time series analysis techniques may be divided into parametric and non-parametric methods. The parametric approaches assume that the underlying stationary stochastic process has a certain structure which can be described using a small number of parameters (for example, using an autoregressive or moving-average model). In these approaches, the task is to estimate the parameters of the model that describes the stochastic process. By contrast, non-parametric approaches explicitly estimate the covariance or the spectrum of the process without assuming that the process has any particular structure.
Methods of time series analysis may also be divided into linear and non-linear, and univariate and multivariate.
Sign in to keep reading
6 more chapters are free with a Lably account.
Panel data
A time series is one type of panel data. Panel data is the general class, a multidimensional data set, whereas a time series data set is a one-dimensional panel (as is a cross-sectional dataset). A data set may exhibit characteristics of both panel data and time series data. One way to tell is to ask what makes one data record unique from the other records. If the answer is the time data field, then this is a time series data set candidate. If determining a unique record requires a time data field and an additional identifier which is unrelated to time (e.g. student ID, stock symbol, country code), then it is panel data candidate. If the differentiation lies on the non-time identifier, then the data set is a cross-sectional data set candidate.
Analysis
There are several types of motivation and data analysis available for time series which are appropriate for different purposes.
Motivation
In the context of statistics, econometrics, quantitative finance, seismology, meteorology, and geophysics the primary goal of time series analysis is forecasting. In the context of signal processing, control engineering and communication engineering it is used for signal detection. Other applications are in data mining, pattern recognition and machine learning, where time series analysis can be used for clustering, classification, query by content, anomaly detection as well as forecasting.
Exploratory analysis
A simple way to examine a regular time series is manually with a line chart. The datagraphic shows tuberculosis deaths in the United States, along with the yearly change and the percentage change from year to year. The total number of deaths declined in every year until the mid-1980s, after which there were occasional increases, often proportionately - but not absolutely - quite large.
A study of corporate data analysts found two challenges to exploratory time series analysis: discovering the shape of interesting patterns, and finding an explanation for these patterns. Visual tools that represent time series data as heat map matrices can help overcome these challenges.
Estimation, filtering, and smoothing
This approach may be based on harmonic analysis and filtering of signals in the frequency domain using the Fourier transform, and spectral density estimation. Its development was significantly accelerated during World War II by mathematician Norbert Wiener, electrical engineers Rudolf E. Kálmán, Dennis Gabor and others for filtering signals from noise and predicting signal values at a certain point in time.
An equivalent effect may be achieved in the time domain, as in a Kalman filter; see filtering and smoothing for more techniques.
Other related techniques include:
- Autocorrelation analysis to examine serial dependence
- Spectral analysis to examine cyclic behavior which need not be related to seasonality. For example, sunspot activity varies over 11 year cycles. Other common examples include celestial phenomena, weather patterns, neural activity, commodity prices, and economic activity.
- Separation into components representing trend, seasonality, slow and fast variation, and cyclical irregularity: see trend estimation and decomposition of time series
Curve fitting
Curve fitting is the process of constructing a curve, or mathematical function, that has the best fit to a series of data points, possibly subject to constraints. Curve fitting can involve either interpolation, where an exact fit to the data is required, or smoothing, in which a "smooth" function is constructed that approximately fits the data. A related topic is regression analysis, which focuses more on questions of statistical inference such as how much uncertainty is present in a curve that is fit to data observed with random errors. Fitted curves can be used as an aid for data visualization, to infer values of a function where no data are available, and to summarize the relationships among two or more variables. Extrapolation refers to the use of a fitted curve beyond the range of the observed data, and is subject to a degree of uncertainty since it may reflect the method used to construct the curve as much as it reflects the observed data.
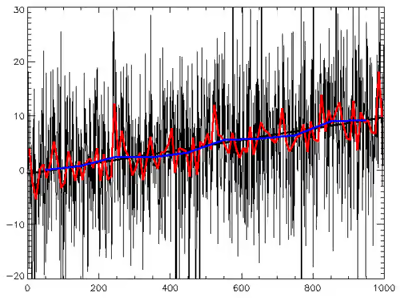
For processes that are expected to generally grow in magnitude one of the curves in the graphic (and many others) can be fitted by estimating their parameters.
The construction of economic time series involves the estimation of some components for some dates by interpolation between values ("benchmarks") for earlier and later dates. Interpolation is estimation of an unknown quantity between two known quantities (historical data), or drawing conclusions about missing information from the available information ("reading between the lines"). Interpolation is useful where the data surrounding the missing data is available and its trend, seasonality, and longer-term cycles are known. This is often done by using a related series known for all relevant dates. Alternatively polynomial interpolation or spline interpolation is used where piecewise polynomial functions are fitted in time intervals such that they fit smoothly together. A different problem which is closely related to interpolation is the approximation of a complicated function by a simple function (also called regression). The main difference between regression and interpolation is that polynomial regression gives a single polynomial that models the entire data set. Spline interpolation, however, yield a piecewise continuous function composed of many polynomials to model the data set.
Extrapolation is the process of estimating, beyond the original observation range, the value of a variable on the basis of its relationship with another variable. It is similar to interpolation, which produces estimates between known observations, but extrapolation is subject to greater uncertainty and a higher risk of producing meaningless results.
Function approximation
In general, a function approximation problem asks us to select a function among a well-defined class that closely matches ("approximates") a target function in a task-specific way. One can distinguish two major classes of function approximation problems: First, for known target functions, approximation theory is the branch of numerical analysis that investigates how certain known functions (for example, special functions) can be approximated by a specific class of functions (for example, polynomials or rational functions) that often have desirable properties (inexpensive computation, continuity, integral and limit values, etc.).
Second, the target function, call it g, may be unknown; instead of an explicit formula, only a set of points (a time series) of the form (x, g(x)) is provided. Depending on the structure of the domain and codomain of g, several techniques for approximating g may be applicable. For example, if g is an operation on the real numbers, techniques of interpolation, extrapolation, regression analysis, and curve fitting can be used. If the codomain (range or target set) of g is a finite set, one is dealing with a classification problem instead. A related problem of online time series approximation is to summarize the data in one-pass and construct an approximate representation that can support a variety of time series queries with bounds on worst-case error.
To some extent, the different problems (regression, classification, fitness approximation) have received a unified treatment in statistical learning theory, where they are viewed as supervised learning problems.
Prediction and forecasting
In statistics, prediction is a part of statistical inference. One particular approach to such inference is known as predictive inference, but the prediction can be undertaken within any of the several approaches to statistical inference. Indeed, one description of statistics is that it provides a means of transferring knowledge about a sample of a population to the whole population, and to other related populations, which is not necessarily the same as prediction over time. When information is transferred across time, often to specific points in time, the process is known as forecasting.
- Fully formed statistical models for stochastic simulation purposes, so as to generate alternative versions of the time series, representing what might happen over non-specific time-periods in the future
- Simple or fully formed statistical models to describe the likely outcome of the time series in the immediate future, given knowledge of the most recent outcomes (forecasting).
- Forecasting on time series is usually done using automated statistical software packages and programming languages, such as Julia, Python, R, SAS, SPSS and many others.
- Forecasting on large scale data can be done with Apache Spark using the Spark-TS library, a third-party package.
Classification
Assigning time series pattern to a specific category, for example identify a word based on series of hand movements in sign language.
Segmentation
Splitting a time-series into a sequence of segments. It is often the case that a time-series can be represented as a sequence of individual segments, each with its own characteristic properties. For example, the audio signal from a conference call can be partitioned into pieces corresponding to the times during which each person was speaking. In time-series segmentation, the goal is to identify the segment boundary points in the time-series, and to characterize the dynamical properties associated with each segment. One can approach this problem using change-point detection, or by modeling the time-series as a more sophisticated system, such as a Markov jump linear system.
Clustering
Time series data may be clustered, however special care has to be taken when considering subsequence clustering. Time series clustering may be split into
- whole time series clustering (multiple time series for which to find a cluster)
- subsequence time series clustering (single timeseries, split into chunks using sliding windows)
- time point clustering
Subsequence time series clustering
Subsequence time series clustering resulted in unstable (random) clusters induced by the feature extraction using chunking with sliding windows. It was found that the cluster centers (the average of the time series in a cluster - also a time series) follow an arbitrarily shifted sine pattern (regardless of the dataset, even on realizations of a random walk). This means that the found cluster centers are non-descriptive for the dataset because the cluster centers are always nonrepresentative sine waves.
Models
Classical models (AR, ARMA, ARIMA, and well-known variations)
Models for time series data can have many forms and represent different stochastic processes. When modeling variations in the level of a process, three broad classes of practical importance are the autoregressive (AR) models, the integrated (I) models, and the moving-average (MA) models. These three classes depend linearly on previous data points. Combinations of these ideas produce autoregressive moving-average (ARMA) and autoregressive integrated moving-average (ARIMA) models. The autoregressive fractionally integrated moving-average (ARFIMA) model generalizes the former three. Another important generalization is the time-varying autoregressive (TVAR) model, in which the AR coefficients are allowed to change over time, enabling the model to capture evolving or non-stationary dynamics. Extensions of these classes to deal with vector-valued data are available under the heading of multivariate time-series models and sometimes the preceding acronyms are extended by including an initial "V" for "vector", as in VAR for vector autoregression. An additional set of extensions of these models is available for use where the observed time-series is driven by some "forcing" time-series (which may not have a causal effect on the observed series): the distinction from the multivariate case is that the forcing series may be deterministic or under the experimenter's control. For these models, the acronyms are extended with a final "X" for "exogenous".
Recent work on the finite-sample behaviour of the sample autocorrelation function (ACF) has also raised questions about the way classical AR, MA, ARMA and related models are identified and diagnosed in practice. Hassani's −1/2 theorem shows that, for the conventional mean-corrected sample ACF with a common denominator, the sum of all positive-lag sample autocorrelations of any non-constant finite sample is exactly .
This identity creates an exact finite-sample dependence among the estimated autocorrelations. Consequently, the complete set of sample ACF values cannot be treated as mutually independent, even though standard asymptotic theory may approximate a fixed and relatively small number of sample autocorrelations as approximately normal and weakly correlated.
This distinction has implications for classical model identification because AR, MA and ARMA models are commonly distinguished using the theoretical shapes of the ACF and PACF, while in practice these quantities are estimated from finite samples and are therefore subject to the −1/2 constraint. The issue is particularly relevant when a large number of lags is examined, when memory properties are inferred from cumulative autocorrelation behaviour, or when residual whiteness is assessed using portmanteau statistics.
Subsequent studies have reported that the joint finite-sample behaviour of sample autocorrelations can depart from simple independent-normal approximations when many lags are considered, with potential consequences for model identification, adequacy testing and the interpretation of short- and long-memory behaviour.
The −1/2 theorem does not imply that classical AR, ARMA or ARIMA models are invalid. Rather, it identifies an important distinction between theoretical autocorrelation functions and their finite-sample estimates, and suggests that classical ACF-based model identification and diagnostic procedures should be interpreted carefully when many sample lags are used.
Time-varying autoregressive (TVAR) models
Time-varying autoregressive (TVAR) models are especially useful for analyzing non-stationary time series in which the underlying dynamics evolve over time in complex ways, not limited to classical forms of variation such as trends or seasonal patterns. Unlike classical AR models with fixed parameters, TVAR models allow the autoregressive coefficients to vary as functions of time, typically represented through basis function expansions whose form and complexity are determined by the user, allowing for highly flexible modeling of time-varying behavior, which enables them to capture specific non-stationary patterns exhibited by the data. This flexibility makes them well suited to modeling structural changes, regime shifts, or gradual evolutions in a system's behavior. TVAR time-series models are widely applied in fields such as signal processing, economics, finance, reliability and condition monitoring, telecommunications, neuroscience, climate sciences, and hydrology, where time series often display dynamics that traditional linear models cannot adequately represent. Estimation of TVAR models typically involves methods such as kernel smoothing, recursive least squares, or Kalman filtering.
Non-linear models
Non-linear dependence of the level of a series on previous data points is of interest, partly because of the possibility of producing a chaotic time series. However, more importantly, empirical investigations can indicate the advantage of using predictions derived from non-linear models, over those from linear models, as for example in nonlinear autoregressive exogenous models. Further references on nonlinear time series analysis: (Kantz and Schreiber), and (Abarbanel)
Among other types of non-linear time series models, there are models to represent the changes of variance over time (heteroskedasticity). These models represent autoregressive conditional heteroskedasticity (ARCH) and the collection comprises a wide variety of representation (GARCH, TARCH, EGARCH, FIGARCH, CGARCH, etc.). Here changes in variability are related to, or predicted by, recent past values of the observed series. This is in contrast to other possible representations of locally varying variability, where the variability might be modeled as being driven by a separate time-varying process, as in a doubly stochastic model.
Other modeling approaches
In a recent work on "model-free" analyses (a term often used to refer to analyses that do not rely on modeling the processes evolution over time with a parametric mathematical expression), wavelet transform based methods (for example locally stationary wavelets and wavelet decomposed neural networks) have gained favor. Multiscale (often referred to as multiresolution) techniques decompose a given time series, attempting to illustrate time dependence at multiple scales. See also Markov switching multifractal (MSMF) techniques for modeling volatility evolution.
A hidden Markov model (HMM) is a statistical Markov model in which the system being modeled is assumed to be a Markov process with unobserved (hidden) states. An HMM can be considered as the simplest dynamic Bayesian network. HMM models are widely used in speech recognition, for translating a time series of spoken words into text.
Many of these models are collected in the python package sktime.
Notation
A number of different notations are in use for time-series analysis. A common notation specifying a time series X that is indexed by the natural numbers is written
- X = (X1, X2, ...).
Another common notation is
- Y = (Yt: t ∈ T),
where T is the index set.
Conditions
There are two sets of conditions under which much of the theory is built:
- Stationary process
- Ergodic process
Ergodicity implies stationarity, but the converse is not necessarily the case. Stationarity is usually classified into strict stationarity and wide-sense or second-order stationarity. Both models and applications can be developed under each of these conditions, although the models in the latter case might be considered as only partly specified.
In addition, time-series analysis can be applied where the series are seasonally stationary or non-stationary. Situations where the amplitudes of frequency components change with time can be dealt with in time-frequency analysis which makes use of a time–frequency representation of a time-series or signal.
Tools
Tools for investigating time-series data include:
- Consideration of the autocorrelation function and the spectral density function (also cross-correlation functions and cross-spectral density functions)
- Scaled cross- and auto-correlation functions to remove contributions of slow components
- Performing a Fourier transform to investigate the series in the frequency domain
- Performing a clustering analysis
- Discrete, continuous or mixed spectra of time series, depending on whether the time series contains a (generalized) harmonic signal or not
- Use of a filter to remove unwanted noise
- Principal component analysis (or empirical orthogonal function analysis)
- Singular spectrum analysis
- "Structural" models:
- General state space models
- Unobserved components models
- Machine learning
- Artificial neural networks
- Support vector machine
- Fuzzy logic
- Gaussian process
- Genetic programming
- Gene expression programming
- Hidden Markov model
- Multi expression programming
- Queueing theory analysis
- Control chart
- Shewhart individuals control chart
- CUSUM chart
- EWMA chart
- Detrended fluctuation analysis
- Nonlinear mixed-effects modeling
- Dynamic time warping
- Dynamic Bayesian network
- Time-frequency analysis techniques:
- Fast Fourier transform
- Continuous wavelet transform
- Short-time Fourier transform
- Chirplet transform
- Fractional Fourier transform
- Chaotic analysis
- Correlation dimension
- Recurrence plots
- Recurrence quantification analysis
- Lyapunov exponents
- Entropy encoding
Measures
Time-series metrics or features that can be used for time series classification or regression analysis:
- Univariate linear measures
- Moment (mathematics)
- Spectral band power
- Spectral edge frequency
- Accumulated energy (signal processing)
- Characteristics of the autocorrelation function
- Hjorth parameters
- FFT parameters
- Autoregressive model parameters
- Mann–Kendall test
- Univariate non-linear measures
- Measures based on the correlation sum
- Correlation dimension
- Correlation integral
- Correlation density
- Correlation entropy
- Approximate entropy
- Sample entropy
- Fourier entropy
- Wavelet entropy
- Dispersion entropy
- Fluctuation dispersion entropy
- Rényi entropy
- Higher-order methods
- Marginal predictability
- Dynamical similarity index
- State space dissimilarity measures
- Lyapunov exponent
- Permutation methods
- Local flow
- Other univariate measures
- Algorithmic complexity
- Kolmogorov complexity estimates
- Hidden Markov model states
- Rough path signature
- Surrogate time series and surrogate correction
- Loss of recurrence (degree of non-stationarity)
- Bivariate linear measures
- Maximum linear cross-correlation
- Linear Coherence (signal processing)
- Bivariate non-linear measures
- Non-linear interdependence
- Dynamical Entrainment (physics)
- Measures for phase synchronization
- Measures for phase locking
- Similarity measures:
- Cross-correlation
- Dynamic time warping
- Hidden Markov model
- Edit distance
- Total correlation
- Newey–West estimator
- Prais–Winsten transformation
- Data as vectors in a metrizable space
- Minkowski distance
- Mahalanobis distance
- Data as time series with envelopes
- Global standard deviation
- Local standard deviation
- Windowed standard deviation
- Data interpreted as stochastic series
- Data interpreted as a probability distribution function
Visualization
Time series can be visualized with two categories of chart: Overlapping Charts and Separated Charts. Overlapping Charts display all-time series on the same layout while Separated Charts presents them on different layouts (but aligned for comparison purpose)
Overlapping charts
- Braided graphs
- Line charts
- Slope graphs
- GapChart
Separated charts
- Horizon graphs
- Reduced line chart (small multiples)
- Silhouette graph
- Circular silhouette graph
History
Jevons was the first to study times series. In his book he examined a number of weekly financial time series between the years 1825 to 1860 inclusive. These included times series of bankruptcies, currency circulation and discount rates.