


Related on Lably
Through Environmental issues, Deforestation and Biodiversity
The extent of primary forest loss in Madagascar has been the subject of debate. What is certain is that the arrival of humans on Madagascar some 2000+ years ago began a process of fire, cultivation, logging and grazing that has reduced forest cover. Industrial forest exploitation during the Merina monarchy and French colonialism contributed to forest loss. Evidence from air photography and remote sensing suggest that by c. 2000, around 40% to 50% of the forest cover present in 1950 was lost. Current hotspots for deforestation include dry forests in the southwest being converted for maize cultivation and rain forests in the northeast exploited for tropical hardwoods.
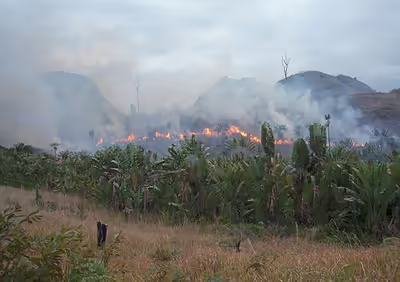
Primary causes of forest loss include slash-and-burn for agricultural land (a practice known locally as tavy) and for pasture, selective logging for precious woods or construction material, the collection of fuel wood (including charcoal production) and, in certain sites, forest clearing for mining.
History of deforestation in Madagascar
Early history
Deforestation by life in Madagascar by human intervention first made an impact on its highland forests as early as AD 600 in the establishment of swidden fields by Indonesian settlers. The creation of swidden fields is a subsistence method of agriculture that has been practiced by humans across the globe for over 12000 years by means of a slash-and-burn technique that clears an area in preparation for crop growth. An increase in the rate of forest removal was seen around AD 1000 with the introduction of cattle from Africa, compelling Malagasy islanders to expand their grassland grazing areas. Historical records point to the importance that this impact has caused with the disappearance of most of Madagascar's highland forest by 1600 AD. Attempts to conserve Madagascar's forests were introduced by rulers in the establishment of environmental regulations, the earliest being seen in 1881 when Queen Ranavalona II placed a ban on using slash-and-burn techniques in agriculture. These efforts aimed to protect the future of the countries rainforests, however, it has been estimated that over 80 percent of Madagascar's original forests are gone with half of this loss occurring since the late 1950s.
Recent history
Early estimates of deforestation in Madagascar were unreliable until using data taken over a 35-year period from a combination of aerial photography, taken in 1950, and more recently data from satellite imagery available since 1972 were used to clearly see the extent of rainforest cleared in the eastern areas of Madagascar. By 1985, only 50 percent of the 7.6 million hectares that existed in 1950 remained equating to an average deforestation rate of over 111,000 hectares per year and by 2005 the country had seen a total of 854,000 hectares of forest lost since 1990. Since the first evidence of human occupation less than 2000 years ago the island of Madagascar's population in 2002 had grown to about 12 million people (McConnell, 2002). Agricultural fires, erosion and soil degradation continue to contribute to the degradation of the countries ecological stability impeding forest regrowth and according to recent data taken over the 2001 – 2012 period the rate of forest loss in Madagascar's has continued to increase.
As shown in the diagram on the left, Madagascar can be divided into four climatic ecoregions with four forest types: moist forest in the East (green), dry forest in the West (orange), spiny forest in the South (red), and mangrove forests along the West coast (blue). Ecoregions were defined following climatic and vegetation criteria. The dark grey areas represent the remaining natural forest cover for the year 2014. Forest types are defined on the basis of their belonging to one of the four ecoregions.
The main figure in the diagram on the right shows the changes in forest cover from 1973 to 2014. Forest cover in 1953 is shown in the bottom-right inset. Two zooms in the western dry (left part) and eastern moist (right part) ecoregions present more detailed views of (from top to bottom): forest cover in 1953, forest cover change from 1973 to 2014, forest fragmentation in 2014 and distance to forest edge in 2014. Data on water bodies (blue) and water seasonality (light blue for seasonal water to dark blue for permanent water) have been extracted from Pekel et al. (2016).
Sign in to keep reading
7 more chapters are free with a Lably account.
Causes
Agriculture
The primary cause for deforestation in Madagascar is the slash-and-burn practice. Historically and culturally known as tavy, the process involves setting vegetation alight after being cut down, creating potential land for rice cultivation. Coupled with the establishment of rural communities who undertake farming, hectares of forest are lost to agriculture.
Population increase
Since the 1940s, the population in Madagascar has rapidly increased, putting pressure on the land available for housing and farming. Thousands of hectares of rainforests have been cut down in order to provide for the increased population.
Firewood
As 40% of Madagascar's rural population lives in poverty and has little to no access to electricity, they have to resort to using firewood for completing daily tasks. Consuming approximately 100 kg of firewood monthly, Madagascan households use this energy for cooking, home heating and lighting.
Timber
The Masoala Peninsula, in Madagascar's east, consists of valuable hardwood timber. Mostly ebony and rosewood, rainforests are degraded in order to satisfy a high demand within the international market.
Illegal logging
Illegal logging in Madagascar has been a problem for decades and is perpetuated by extreme poverty and government corruption. Often taking the form of selective logging, the trade has been driven by high international demand for expensive, fine-grained lumber such as rosewood and ebony. Historically, logging and exporting in Madagascar have been regulated by the Malagasy government, although the logging of rare hardwoods was explicitly banned from protected areas in 2000. Since then, government orders and memos have intermittently alternated between permitting and banning exports of precious woods. The most commonly cited reason for permitting exports is to salvage valuable wood from cyclone damage, although this reasoning has come under heavy scrutiny. This oscillating availability of Malagasy rosewood and other precious woods has created a market of rising and falling prices, allowing traders or "timber barons" to stockpile illegally sourced logs during periodic bans and then flood the market when the trade windows open and prices are high.
Environmental impacts
Biodiversity
Since its divergence from Africa over 88 million years ago, Madagascar has evolved into an incredibly biodiverse island. Including more than 13000 plants and 700 vertebrates, close to 90% of Madagascar's species are endemic and are found nowhere else in the world. However, with deforestation depleting key habitats and food resources, over 8000 species are either classified as vulnerable or endangered and some, including 15 species of lemur, have actually gone extinct. Coupled with its geographic isolation thus increasing vulnerability to destruction, deforestation will continue to impact Madagascar's flora and fauna, increasing rates of extinction.
Lemurs are an endemic species of primates to the island of Madagascar. They act as pollinators, seed dispersers, and prey in their ecosystems. The majority of lemurs are classified as endangered due to human activities, including deforestation. This deforestation has led to different forest types in Madagascar: primary or intact forests, secondary or intermediate forests, mosaic forests, and agricultural land. The primary forests have not been deforested and are the most biodiverse. These forests have the highest abundance of lemurs. The secondary forests are somewhat degraded, but some lemur species are just as abundant in these areas. Mosaic forests are fragmented and are heavily affected by deforestation. Some species of lemurs cannot survive in these forests, while others can. Survival in these mosaic forests depends on a variety of factors, such as diet. Research suggests that omnivores and folivores can tolerate these varying habitats since their diets include a wide variety of food sources. For example, microcebus, an omnivore, has been found living in these forests and takes advantage of the abundance of insects here. However, lemurs that have specialized diets, such as frugivores, are more sensitive to habitat disturbance. These lemurs are found more often in primary forests.
Research in Masoala National Park, the largest protected forest in Madagascar, showed that there was a positive correlation between mean tree height and lemur abundance. This explains why the primary lowland forests, which had the tallest trees and most canopy cover, had the greatest number of lemurs. Lepilemur scotterum, avahi mooreorum, and eulemur albifrons were mostly found in the greatest densities in these areas. Other species, like avahi laniger, allocebus, and microcebus, were found in equal densities in primary, secondary, and degraded forests.
A study of the Antserananomby Forest in western Madagascar in the 1960s and 1970s showed it had the highest population densities for each lemur species living there. A more recent study has shown that much of the forest has been cleared for agricultural use and population densities of lemurs have declined significantly. Reduced forest size has been shown to have a direct negative effect on lemur diversity.
Soil and water
Like many habitats that undergo deforestation, Madagascar experiences soil erosion, of which can adversely affect river systems and lakes. In the case of Lake Alaotra in Ambatondrazaka area, in the country's east, deforestation in the hills above has caused heavy erosion, leading to increased sedimentation in the lake. As result, Lake Alaotra has actually decreased in size by approximately 30% in last 40 years. Moreover, the water quality of the lake has suffered, thus reducing the productivity of neighbouring rice cultivations. Soil can also become infertile after vegetation clearing. When plants die or shed their leaves, micro-organisms in soil decompose the leaf litter as they consume it, breaking it down to key nutrients valuable to future plant growth. Should this biomass be removed, there will be no nutrient recycling, reducing soil fertility and reducing plant growth.
Atmosphere and climate
Deforestation in Madagascar, as well as other parts of the world, can have an influence on climate. When the forest is cleared, the understorey is left exposed to the sun to a greater extent than before. This increased sunlight reduces soil moisture and increases rates of evapotranspiration in plants, ultimately dehydrating them and stunting growth. At a global level, deforestation is also known to have an effect on carbon dioxide levels in the atmosphere through;
- Slash-and-burn practices: Used primarily to create agricultural land, it involves the logging of forests and burning debris afterwards.
- Disruption of photosynthesis: Plants absorb atmospheric carbon dioxide, as well water, in order to form their biomass and oxygen. Without plants, carbon dioxide is not absorbed.
It is with the loss of crucial carbon sinks and continuation of slash-and-burn deforestation that carbon dioxide levels will continue to increase in the atmosphere, ultimately contributing to global warming.
Economic impacts
Economic impacts of deforestation in Madagascar closely align with the degradation of its natural environment and resources. Examples exist within;
Agriculture
While a key cause of deforestation, agriculture can also be one of its victims. Without vegetation to anchor soil, the chance of erosion increases, sending close to 400 tonnes/ha of sediment into waterways annually. As a result, water quality decreases and coupled with a lack of nutrient cycling due to minimal biomass, plant productivity is reduced, including valuable rice crops.
Medicine
As a product of its biodiversity, Madagascar has a vast array of plant species, with 2,300 having medicinal properties that treat many illness, from common ailments to cancers. Should deforestation continue, the pharmaceutical industry will lose a key resource, eventually suffering decreases in profit.
Ecotourism
Madagascar possesses a vast array of species, 90% of which are only unique to the island. With deforestation destroying habitats and causing increased extinctions, Madagascar will potentially lose a great tourism asset, eliminating incentive to invest in ecotourism operations (such as resorts, recreational facilities, and national parks), thus decreasing long-lasting employment opportunities for local communities.
Reforestation efforts
Despite the deforestation trend, tree cover is increasing in some parts of the country, though largely of introduced (non-native) species such as Eucalyptus (various species), pine (Pinus kesiya, Pinus patula,) silver wattle (Acacia dealbata), silky oak (Grevillea banksii), and paperbark/niaouli ("Melaleuca quinquenervia"). Some of these trees are planted by foresters and farmers; others have become invasive of their own accord. Reforestation by eucalypts, pines, and wattles has been demonstrated, for instance, in the central highlands.
Reforestation efforts with native species, particularly in rainforest corridors, have had mixed success. Some reforestation efforts have been conducted by Rio Tinto, a mining organization. This effort includes the set-up of 2 tree nurseries near Fort Dauphin. The nurseries are called the Rio Tinto QMM's nurseries. The nurseries plant some 600 tree species native to Madagascar. However, in 2003, Rio Tinto also announced plans to mine ilmenite (used to make toothpaste and paint) in southern Madagascar. These plans included the creation of a new port, roads, and other facilities. Mostly migrant workers would be employed, despite high levels of unemployment in the region. This unemployment and poverty drives charcoal production, which is a major factor in deforestation in that region.
Tree cover extent and loss
Global Forest Watch publishes annual estimates of tree cover loss and 2000 tree cover extent derived from time-series analysis of Landsat satellite imagery in the Global Forest Change dataset. In this framework, tree cover refers to vegetation taller than 5 m (including natural forests and tree plantations), and tree cover loss is defined as the complete removal of tree cover canopy for a given year, regardless of cause.
For Madagascar, country statistics report cumulative tree cover loss of 5,153,136 ha (51,531.36 km2) from 2001 to 2024 (about 30.1% of its 2000 tree cover area). For tree cover density greater than 30%, country statistics report a 2000 tree cover extent of 17,141,084 ha (171,410.84 km2). The charts and table below display this data. In simple terms, the annual loss number is the area where tree cover disappeared in that year, and the extent number shows what remains of the 2000 tree cover baseline after subtracting cumulative loss. Forest regrowth is not included in the dataset.
Annual tree cover loss in Madagascar, 2001–2024. View chart definition.Tree cover extent in 2000 minus cumulative tree cover loss in Madagascar, 2001–2024 (loss-only residual; does not account for gain). View chart definition.
REDD+ forest reference emission levels and monitoring
Under the UNFCCC REDD+ framework, Madagascar has submitted national forest reference emission levels (FRELs). On the UNFCCC REDD+ Web Platform, the country's 2017 and 2018 submissions are both listed as having assessed reference levels, while the other Warsaw Framework elements—a national strategy, safeguards, and a national forest monitoring system—are listed as “not reported” for those submissions.
The first assessed national FREL, submitted in 2017, covered the REDD+ activity “reducing emissions from deforestation” and was assessed at 20,474,434 t CO2 eq per year for the historical reference period 2005–2013. The technical assessment reported that this first FREL included above-ground and below-ground biomass of living trees and standing dead trees, and included CO2, methane (CH4) and nitrous oxide (N2O), with only natural forests considered and secondary forests and plantations excluded in identifying deforestation.
A second national FREL was submitted in 2018, again covering reducing emissions from deforestation at national scale. Following the technical assessment and a modified submission, the assessed FREL was 34,342,327 t CO2 eq per year for the revised historical reference period 2006–2015. According to the 2018 technical assessment, the increase relative to the 2017 assessed FREL was due mainly to new above-ground biomass and deadwood data for the dry forest ecoregion and new activity data based on stratified sampling of Madagascar's four forest ecoregions. In the 2018 submission, the FREL included above-ground biomass, below-ground biomass, deadwood and soil organic carbon, and included CO2 as well as CH4 and N2O from burning on deforested land.