


Related on Lably
Through Mississippi and Atmospheric pressure
The four Category 5 hurricanes during the season were Emily, Katrina, Rita, and Wilma. In July, Emily reached peak intensity in the Caribbean Sea, becoming the first Category 5 hurricane of the season, later weakening and striking Mexico twice. It was the first Category 5 hurricane recorded in the month of July and was the earliest-forming Category 5 hurricane on record, until Hurricane Beryl surpassed the record in July 2024. In August, Katrina reached peak winds in the Gulf of Mexico but weakened by the time it struck the U.S. states of Louisiana and Mississippi. The most devastating effects of the season were felt on the Gulf Coast of the United States, where Katrina's storm surge crippled New Orleans, Louisiana, for weeks and devastated the Mississippi coastline. Katrina became the costliest U.S. hurricane, leaving $125 billion in damage and 1,392 deaths. Rita followed in September, reaching peak intensity in the Gulf of Mexico before weakening and hitting near the border of Texas and Louisiana. The season's strongest hurricane, Wilma, became the most intense Atlantic hurricane on record, as measured by barometric pressure. Lasting for ten days in October, Wilma moved over Cozumel, the Yucatán Peninsula, and Florida, causing over $22 billion in damage and 52 deaths.
The season's impact was widespread and catastrophic. Its storms caused an estimated 3,468 deaths and approximately $171.7 billion in damage. It was the costliest season on record at the time, until its record was surpassed 12 years later. It also produced the second-highest accumulated cyclone energy (ACE) in the Atlantic basin, only behind the 1933 season. The season officially began on June 1, 2005, and the first storm, Arlene, developed on June 8. Hurricane Dennis in July inflicted heavy damage to Cuba. Hurricane Stan in October was part of a broader weather system that killed 1,673 people and caused $3.96 billion in damage to eastern Mexico and Central America, with Guatemala hit the hardest. The final storm, Zeta, formed in late December and lasted until January 6, 2006, the latest of any season, tied with 1954.
Seasonal forecasts
Ahead of the formal start of the season, various groups issued forecasts for the number of named storms, hurricanes, and major hurricanes in the upcoming season, including Colorado State University (CSU), the Cuban Institute of Meteorology (InsMet), Tropical Storm Risk (TSR), and the United States National Oceanic and Atmospheric Administration (NOAA). Some forecasts predicted how many tropical cyclones would affect a particular country or territory.
Pre-season forecasts
The first of these forecasts was issued by CSU, which predicted on December 5, 2004 that the season would be above average and feature 11 named storms, 6 hurricanes and 3 intense hurricanes. They also noted that the Caribbean and the entire United States coastline faced an increased risk of a major hurricane making landfall. TSR issued its first forecast a few days later and predicted that the season would feature 9.6 tropical storms, 5.7 hurricanes, 3.3 major hurricanes, and predicted that the accumulated cyclone energy (ACE) rating would be 145.
During January 2005, TSR increased its forecast to 13.9 tropical storms, 7.8 hurricanes, 3.6 major hurricanes, and predicted that the ACE rating would be 157. CSU issued its first updated forecast on April 1, increasing their prediction to 13 tropical storms, 7 hurricanes, and 3 major hurricanes, with a continued risk of a major hurricane landfall in the Caribbean or United States. The increase was based on the Atlantic continuing to warm and a strong belief that El Niño conditions would not persist into the hurricane season. On May 2, the Cuban Institute of Meteorology (InsMet) issued their seasonal forecast, which predicted that the season would feature 13 tropical storms and 7 hurricanes. This was followed on May 16 by NOAA, who predicted a 70% chance of above normal activity, with 12–15 tropical storms, 7–9 hurricanes, and 3–5 major hurricanes. The agency cited favorable conditions associated with an active phase of the Atlantic multidecadal oscillation (AMO). CSU issued its second forecast update on May 31, revising its forecast to 15 named storms, 8 hurricanes and 4 major hurricanes; by this point, the group believed El Niño conditions were unlikely.
Midseason outlooks
In their July forecast update, TSR anticipated that the season would be exceptionally active and well above average; the group increased their forecast to 15.3 tropical storms, 8.8 hurricanes, and 4.1 major hurricanes, with an ACE rating of 190. By the end of July, seven tropical storms and two major hurricanes had developed within the basin, which prompted CSU, InsMet, NOAA and TSR to significantly increase their seasonal forecasts at the start of August. In their August 5 update, CSU predicted that 13 more storms would form, with seven more hurricanes and three more major hurricanes. At the start of September, CSU updated their forecasts and predicted that eight more storms would form, with six more hurricanes and three major hurricanes. By the end of September, 17 named storms had developed, of which nine had developed into hurricanes and four had become major hurricanes. Within their final update for the year, CSU predicted that October would feature three named storms, two hurricanes and one major hurricane.
Sign in to keep reading
4 more chapters are free with a Lably account.
Seasonal summary
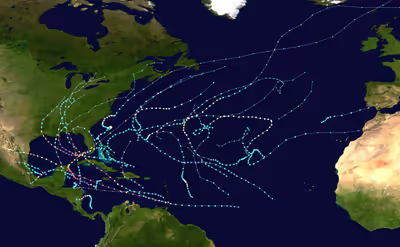
With 28 storms (27 named storms and one unnamed), the 2005 Atlantic hurricane season set a new single-year record for most storms, surpassing the total of 20 from 1933. This record stood until surpassed by the 2020 season, which had 30 storms, making it the second-most active season on record . Before August 1, a record seven named storms formed, surpassing 1997, and later eclipsed by 2020. Further, the months of July and November set records for number of named storms, with 5 and 3, respectively. The 2005 season featured 15 hurricanes, surpassing the previous record of 12, set in 1969. Of the 15 hurricanes, 5 formed in September, with the season becoming only the sixth to feature 5 in that month. The 2005 season also featured a record seven major hurricanes, one more than the previous record, set in 1926, 1933, 1950, 1996, and 2004. The four Category 5 hurricanes were also a record. The season's activity was reflected with an ACE rating of 244, the second-highest value on record in the Atlantic basin, after the 1933 season. The storms of the season were extraordinarily damaging and were responsible for significant loss of life. Total damage is estimated to be about US$171.7 billion, and the seasons' storms contributed to the deaths of 3,912 people. There were a record 15 storms making landfall, including seven storms that struck the United States.
Meteorological conditions
The extremely active 2005 hurricane season was a continuation of an extended sequence of active years for tropical activity in the Atlantic. Tropical cyclone activity in the Atlantic Ocean between 1995 and 2004 was more active than any other decade in reliable record. With the exception of two years in which El Niño conditions were prevalent (1997 and 2002), all hurricane seasons since 1995 were individually above average. This was associated with an active phase of the Atlantic multidecadal oscillation (AMO), with a similar period of elevated tropical activity occurring between 1950 and 1969. The anomalously frequent formation of tropical storms and hurricanes reflected the emergence of unusually warm sea surface temperatures across the tropical Atlantic.
Chylek and Lesins (2008) determined that the likelihood of a season generating as much tropical activity as 2005 was less than 1 percent. The consecutive occurrence of hurricane seasons as active as 2004 and 2005 in the Atlantic was unprecedented. While environmental conditions favorable for the development of tropical cyclones were analogous to other active seasons, they were more pronounced and encompassed larger areas in 2005. The CPC determined that this environmental enhancement was primarily driven by four factors: the Atlantic multidecadal oscillation, the reduction of atmospheric convection in the tropical Pacific, record-high sea surface temperatures in the tropical Atlantic and Caribbean, and conducive wind and pressure patterns across the western Caribbean and Gulf of Mexico. The multidecadal oscillation increased the potency of conducive environmental factors for tropical development, including the increased strength of subtropical ridges in the northern and southern Atlantic and the eastern Pacific. This amplified the African easterly jet and enhanced upper-level easterlies, attenuating wind shear detrimental to tropical cyclogenesis across the central tropical Atlantic and the Caribbean. Frequent lulls in convection over the tropical Pacific also contributed to the strength of these ridges, focusing hurricane activity in the Atlantic. Most of the tropical storms and all major hurricanes in the Atlantic in 2005 formed when a lack of convection was present near the International Dateline, while a brief uptick in storms near the International Dateline led to a lull in tropical cyclogenesis in the Atlantic for the first half of August.
The Gulf of Mexico saw record levels of tropical activity in 2005, with 11 named storms entering the basin. The unusual activity was attributed to a persistent high pressure area over the Southeastern United States, the northeastward displacement and amplification of the Intertropical Convergence Zone (ITCZ) over the eastern Pacific, and above average sea surface temperatures in the Gulf of Mexico. These factors reduced vertical wind shear and favored cyclonic flow, creating an environment highly supportive of tropical development. The high pressure area also steered incoming storms into the Gulf of Mexico. In addition, the El Niño–Southern Oscillation (ENSO) was in a neutral phase, lowering the likelihood of storms making landfall on the East Coast of the United States and leading to a concentration of impacts farther west. This focusing mechanism led to a complementary reduction in storms developing close to Cape Verde. During the peak of the 2005 season, the Loop Current – an ocean current that transports warm water from the Caribbean Sea northward into the Gulf of Mexico and offshore the U.S. East Coast – propagated northward, reaching its most poleward point in advance of Hurricane Katrina. This protrusion detached into a warm core ring, or a small region of warm waters to an abnormally deep depth, and began to drift southwest as Hurricane Rita traversed the region. By mid-October, the Loop Current returned to its typical position in the Yucatán Peninsula. This evolution provided enhanced ocean heat content to both hurricanes and was partially responsible for the extreme intensities attained by those cyclones. Lowered sea-level atmospheric pressures in the late spring and early summer of 2005 curtailed the strength of trade winds. This allowed the persistence of the anomalously warm sea surface temperatures until November 2005. The activity in later parts of the 2005 season was elevated by the unusual development of four tropical cyclones from non-tropical origins over the eastern Atlantic.
In the wake of the season, questions arose regarding the potential impact of global warming on Atlantic hurricane activity. Hurricane experts noted that establishing a conclusive relationship would be difficult given the significant role that natural variability plays on hurricane formation and significantly improved tropical cyclone detection methods compared to decades past. A series of international workshops were established after 2005. After five years of analysis, researchers were unable to confirm whether the recent increase in tropical cyclone activity could be attributed more to climate change than natural variability. Models developed within the workshops projected that the number of tropical cyclones under Category 3 intensity would fall over the 21st century, while the number of intense Category 4–5 hurricanes would increase significantly. One potential hypothesis for these findings was a projected increase in vertical wind shear contradicted by warmer ocean temperatures for hurricanes to utilize. The team also concluded that the amount of precipitation produced by tropical cyclones would increase over the next century. In May 2020, researchers at the National Oceanic and Atmospheric Administration and the University of Wisconsin at Madison built upon this research and, for the first time, established a statistically significant global trend toward more intense tropical cyclones, particularly in the Atlantic basin. The research not only reaffirmed a trend toward stronger, wetter tropical cyclones, but it also identified a trend toward increased rapid intensification events and a general slowing of tropical cyclones' forward motion near land.
Systems
Tropical Storm Arlene
The season's first tropical depression developed north of Honduras on June 8. Moving generally northward, it intensified into Tropical Storm Arlene, and struck western Cuba on June 10. The storm reached peak winds of 70 mph (110 km/h) early on June 11. Later that day, the storm moved ashore just west of Pensacola, Florida. Over the next two days, Arlene continued northward through the United States, dissipating over southeastern Canada on June 14. In western Cuba, Arlene produced wind gusts of 49 mph (79 km/h) at Punta del Este and 6.81 in (173 mm) of rainfall in the city of Pinar del Río. Arlene left mostly minor damage throughout the United States, estimated at $11.8 million. In Miami Beach, Florida, a student died when she was caught in a rip current. Rainfall in the United States peaked at 9.84 in (250 mm) in Lake Toxaway, North Carolina.
Tropical Storm Bret
A tropical depression formed on June 28 in the Bay of Campeche. It quickly strengthened into Tropical Storm Bret with sustained winds of 40 mph (64 km/h). Bret moved ashore northeastern Mexico near Tuxpan, Veracruz, dissipating early on June 30 over San Luis Potosí. Bret brought heavy rainfall across Mexico, reaching at least 10.47 in (266 mm) in El Raudal, Veracruz. One person drowned in Cerro Azul, while another death occurred in Naranjos due to cardiac arrest. The floods forced the evacuation of approximately 2,800 people, damaged around 3,000 houses, isolated 66 villages, and caused about $100 million (MXN, US$9.2 million) in damage.
Hurricane Cindy
A tropical depression formed on July 3 in the western Caribbean Sea, and crossed the Yucatán Peninsula into the Gulf of Mexico. It strengthened into Tropical Storm Cindy early on July 5, and attained hurricane status a day later, with peak winds of 75 mph (120 km/h). Early on July 6, Cindy struck southeastern Louisiana, and after weakening over land, hit southern Mississippi as a tropical storm. Cindy continued across the southeastern United States and transitioned into an extratropical cyclone on July 7 over The Carolinas; it eventually dissipated over the Gulf of St. Lawrence on July 12.
Across the United States, the hurricane caused $320 million in damage and three fatalities – one in Georgia from flooding, and two in Maryland from a car crash. Across Louisiana, the hurricane left 280,000 people without power. Rainfall in the United States peaked at 9.50 in (241 mm) in Saint Bernard, Louisiana. Cindy spawned a large tornado outbreak, including an F2 tornado near Hampton, Georgia, that caused over $40 million in damage at the Atlanta Motor Speedway alone. The same tornado damaged planes and helicopters at Tara Field, as well as hundreds of homes.
Hurricane Dennis
Tropical Depression Four formed in the southeastern Caribbean late on July 4, and further strengthened into Tropical Storm Dennis early the next day. The storm moved west-northwestward, strengthening into a hurricane on July 6 to the south of Hispaniola. On the next day, Dennis rapidly intensified into a Category 4 hurricane while moving between Jamaica and Haiti. Early on July 8, the hurricane briefly moved over Granma Province in southeastern Cuba. After briefly weakening, Dennis restrengthened to attain peak winds of 150 mph (240 km/h) in the Gulf of Guacanayabo. Later on July 8, Dennis moved ashore again in Matanzas Province. The hurricane crossed Cuba entered the Gulf of Mexico on July 9 as a weakened hurricane. Dennis re-intensified to a secondary peak of 145 mph (233 km/h) on July 10, only to weaken prior to its final landfall later that day near Pensacola, Florida. Dennis weakened and moved through the southeastern United States, the Ohio Valley, and eventually dissipating on July 18 over Ontario.
The outer rainbands of Dennis produced widespread flooding and landslides in Haiti, killing at least 56 people and leaving US$50 million in damage. Dennis brought torrential rain to Jamaica, reaching 24.54 in (623 mm) in Mavis Bank. One person died in Jamaica, and damage was estimated at US$31.7 million. The storm's heaviest rainfall occurred in Cuba, reaching 43.0 in (1,092 mm). Across the island, Dennis killed 16 people, and left US$1.4 billion in damage, affecting agriculture, tourist areas, infrastructure, and houses. Dennis moved ashore Florida near where Hurricane Ivan struck ten months prior. Damage from Dennis in the United States totaled $2.545 billion, and there were 15 deaths in the country, all but one in Florida. Rainfall in the United States reached 12.80 in (325 mm) near Camden, Alabama.
Hurricane Emily
On July 11, a tropical depression formed east of the Lesser Antilles, which quickly intensified into Tropical Storm Emily. Moving westward, Emily strengthened into a minimal hurricane and struck Grenada at that intensity on July 14. Continuing across the Caribbean Sea, Emily eventually strengthened into a Category 5 hurricane on July 16 to the southwest of Jamaica, reaching peak winds of 160 mph (260 km/h). Emily weakened after its peak intensity, striking the northeastern Yucatán Peninsula on July 18 with winds of 135 mph (217 km/h). Emily emerged into the Gulf of Mexico and restrengthened, making another landfall in Mexico on July 18 in Tamaulipas with winds of 125 mph (201 km/h). A day later, Emily dissipated over land.
While moving through the Lesser Antilles, the hurricane produced strong winds and heavy rainfall that caused flooding and landslides across several islands. In Grenada, a man died when a landslide destroyed his house. The hurricane damaged or destroyed 2,641 homes in the country, leaving 167 families homeless. Emily left US$111 million in damage when it struck Grenada. Flooding rains killed ten people in Haiti. In Jamaica, Emily produced 15.43 in (392 mm) of rainfall; associated flooding killed five people on the island. Collectively, Emily and earlier Hurricane Dennis left about US$96 million (J$6 billion) in damage to Jamaica. In Honduras, a man drowned in a river swollen by rains from Emily. Across Mexico, Emily's damage was estimated at Mex$3.427 billion (US$322 million), resulting in disaster areas across four states. There were five deaths in the country related to Emily. The outskirts of Emily dropped heavy rainfall in southern Texas, damaging about $4.7 million worth of cotton.
Tropical Storm Franklin
Tropical Depression Six formed northeast of the Bahamas on July 21, originating from a tropical wave that exited the coast of Africa on July 10. The depression quickly intensified into Tropical Storm Franklin, but wind shear disrupted the storm's initial development. As the storm moved to the north and northeast, it intensified; on July 23, Franklin attained peak winds of 70 mph (110 km/h). Three days later the storm passed west of Bermuda. An approaching trough turned Franklin to the northwest and weakened Franklin to a minimal tropical storm. Franklin restrengthened slightly as it accelerated northeastward. On July 30, the storm transitioned into an extratropical cyclone south of Nova Scotia, and a day later it was absorbed by a larger extratropical storm near Newfoundland.
On July 26, Bermuda recorded wind gusts of 37 mph (60 km/h) while the storm made its closest approach. The storm brought light rainfall to Newfoundland.
Tropical Storm Gert
The same tropical wave that spawned Tropical Storm Franklin later led to the formation of a tropical depression in the Bay of Campeche on July 23. It intensified into Tropical Storm Gert early on July 24, and quickly moved ashore north of Cabo Rojo, Mexico, with 45 mph (72 km/h) winds early on July 25. It continued inland, affecting the same areas impacted by Hurricane Emily just days prior, and quickly dissipated over high terrain at the end of that day. Gert dropped heavy rainfall, reaching 8.46 in (214.9 mm) in San Luis Potosí. Gert caused about US$6 million ($60 million 2005 MXN) in damage, and resulted in one fatality in Nuevo León.
Tropical Storm Harvey
Tropical Depression Eight formed on August 2 southwest of Bermuda from a tropical wave that left the African coast on July 22. The depression strengthened into Tropical Storm Harvey on August 3 while moving northeastward. Due to strong wind shear, Harvey initially exhibited subtropical characteristics. On August 4, Harvey passed 45 miles (72 km) south of Bermuda. After moving away from the island, Harvey attained peak winds of 65 mph (105 km/h) late on August 4 and continued northeastward for a few days, transitioning into an extratropical storm on August 9. The storm gradually weakened and eventually dissipated northwest of the Azores on August 14.
In Bermuda, Harvey dropped 5.02 in (128 mm) of rainfall at Bermuda International Airport, flooding some roads. Sustained winds on the island reached 45 mph (72 km/h).
Hurricane Irene
A tropical wave exited west Africa on August 1, and three days later developed into a tropical depression to the southwest of the Cabo Verde islands. Despite wind shear, the depression strengthened into Tropical Storm Irene on August 7 as it moved northwestward. Dry air weakened Irene back to tropical depression status, but after reaching warmer waters, it restrengthened into a tropical storm on August 11. A weakness in the subtropical ridge allowed Irene to turn sharply northward, which caused the storm to pass midway between the Outer Banks of North Carolina and Bermuda on August 15. After a decrease in wind shear, Irene strengthened into a hurricane on August 16, reaching peak winds of 105 mph (170 km/h) and a minimum pressure of 970 mbar (29 inHg). It again encountered wind shear, causing it to weaken back to tropical storm status on August 18. That day, Irene was absorbed by a larger extratropical storm southeast of Newfoundland.
The hurricane generated strong waves and rip currents along the East Coast of the United States. Near Long Beach, New York, rip currents near Long Beach killed a 16-year-old boy. Many beaches in New Jersey restricted swimming activities, and lifeguards at one beach performed more than a hundred rescues over a three-day period.
Tropical Depression Ten
Tropical Depression Ten formed between the Lesser Antilles and Cape Verde on August 13 from a tropical wave that entered the Atlantic five days earlier. The depression moved slowly westward in an environment of strong vertical shear. Some weather models predicted relaxing shear and intensification of the system; however, the hostile conditions ripped the system apart, causing the depression to degenerate into a remnant low, and the NHC discontinued advisories on August 14, when no organized deep convection remained. The remnants of Tropical Depression Ten continued drifting northwestward, before degenerating further into a tropical wave north of the Leeward Islands, on August 18. Soon afterward, the low-level and mid-level circulations split, with the mid-level circulation lagging behind to the east. The remnant low-level circulation continued westward, before dissipating near Cuba on August 21. Producing occasional bursts of convection, the mid-level remnant circulation eventually merged with another tropical wave, which later produced Hurricane Katrina, approaching from the east, on August 19.
Tropical Storm Jose
A tropical depression developed in the Bay of Campeche on August 22, which quickly strengthened into Tropical Storm Jose. The storm reached a maximum strength of 60 mph (97 km/h). Jose made landfall in the Mexican state of Veracruz near the Laguna Verde Nuclear Power Station on August 23, and rapidly dissipated over land. While drenching Mexico's Gulf coast, Jose forced some 25,000 residents from their homes in Veracruz state and damaged at least 16,000 homes in the state. Jose killed 11 people in Veracruz and 5 in Oaxaca. Damage in Mexico totaled roughly $45 million.
Hurricane Katrina
A tropical depression developed on August 23 from the complex interaction of a tropical wave, the mid-level remnants of Tropical Depression Ten, and a nearby upper-level trough. The depression became a tropical storm on August 24 and a hurricane on August 25, making landfall as a Category 1 hurricane in southeastern Florida. Katrina imparted about $500 million in crop and infrastructure damage to the state. The hurricane quickly crossed Florida and emerged into the Gulf of Mexico. Katrina rapidly intensified to Category 5 status early on August 28, becoming the seventh most intense Atlantic hurricane. Turning northward, the hurricane weakened as it approached the northern Gulf Coast. On August 29 at 11:10 UTC, Katrina made landfall in southeastern Louisiana as a Category 3 hurricane, with 125 mph (201 km/h) winds, and a barometric pressure of 920 mbar (27 inHg); it was the third lowest pressure for a landfalling United States hurricane at the time, and fourth as of 2018. Katrina then crossed the Breton Sound, making a third and final landfall with 120 mph (190 km/h) winds near Pearlington, Mississippi. The cyclone quickly weakened after moving inland and became extratropical over Kentucky on August 30.
On August 28, the New Orleans National Weather Service issued an urgent weather bulletin describing potentially catastrophic impacts, comparing Katrina to Hurricane Camille of 1969. That same day, New Orleans mayor Ray Nagin issued the city's first-ever mandatory evacuation. About 80% of the city and 83% of neighboring Jefferson Parish evacuated ahead of the storm. The hurricane left catastrophic damage across southern Louisiana, with more than 300,000 houses damaged or destroyed; most of these were in Orleans Parish. In New Orleans, a storm surge breached the levees along the Gulf Intracoastal Waterway and 17th Street and London Avenue Canals, flooding about 80% of the city. Portions of the city remained underwater for 43 days. The Mississippi and Alabama coastlines also suffered catastrophic damage from the storm's 30 ft (9.1 m) storm surge, with very few structures remaining on the coast of the former. Across the region, the hurricane flooded and ruined about 350,000 vehicles. About 2.4 million people lost access to clean drinking water. Katrina also spawned an outbreak of 62 tornadoes across the eight states in the eastern United States.
Hurricane Katrina imparted catastrophic damage in portions of Louisiana and Mississippi. Total damage has been estimated at $125 billion, making Katrina the costliest hurricane in U.S. history, surpassing Andrew in 1992 and later tied by Harvey in 2017. Throughout the United States, Katrina killed 1,392 people, making it one of the deadliest hurricanes in the United States, and the deadliest American hurricane since 1928. The Federal Emergency Management Agency (FEMA) managed the aftermath of the hurricane, and faced criticism for its response time, lack of coordination with state agencies, supply shortages, and insufficient housing for federal workers. Tens of thousands of people lost their jobs following the hurricane. Residents across the New Orleans area suffered health effects, including rashes and respiratory problems, from polluted water and air following the hurricane. Katrina forced about 800,000 people to move temporarily, which was the greatest number of displaced people in the country since the Dust Bowl. The United States federal government spent $110.6 billion in relief, recovery and rebuilding efforts, including $16 billion toward rebuilding houses, which was the nation's largest ever housing recovery project. Within a year of the storm, most of the levees were largely repaired. Various countries and international agencies sent supplies or financial aid to assist in the hurricane response.
Tropical Storm Lee
A tropical wave moved off the coast of Africa on August 24. It developed into Tropical Depression Thirteen on August 28 while 960 miles (1,540 km) east of the Lesser Antilles. Strong wind shear prevented much organization, and the depression degenerated into a low pressure area late on August 29. The remnants moved to the north and northeast, steered by a larger non-tropical system to the north. The convection increased on August 31; that day the system regenerated into a tropical depression, which strengthened further into Tropical Storm Lee. The storm attained peak winds of 40 mph (64 km/h) while located between Bermuda and the Azores. After 12 hours as a tropical storm, Lee weakened back to a tropical depression as it turned to the northwest, steered by the larger non-tropical storm. On September 2, the depression degenerated into a remnant low, which was absorbed by a cold front two days later.
Hurricane Maria
A powerful tropical wave moved off the coast of Africa on August 27. As it moved west into the Atlantic, it became more organized and the system developed into Tropical Depression Fourteen about midway between Cape Verde and the Lesser Antilles on September 1. Shear from an upper-level low to the southwest slowed the development. The depression gradually strengthened as it moved to the northwest across the open Atlantic Ocean, becoming Tropical Storm Maria on September 2 and reaching hurricane strength on September 4. In the central Atlantic, Hurricane Maria continued to strengthen in favorable conditions, and on September 5 briefly became a Category 3 hurricane with 115 mph (185 km/h) winds while 480 miles (770 km) east of Bermuda. Increasing shear and cooler waters caused the storm to rapidly weaken to a minimal hurricane on September 7. The interaction with a trough caused Maria to restrengthen slightly, as it curved to the northeast, moving around the subtropical ridge. Maria then weakened to a tropical storm, transitioning into an extratropical cyclone on September 10. The former hurricane restrengthened over the northern Atlantic Ocean, only to weaken again as the storm passed south of Iceland. On September 14, the extratropical storm that was once Maria merged with another extratropical storm while approaching Norway.
The remnants of Maria brought resulted in heavy rainfall to Norway, triggering a landslide in Bergen that killed three people and injured seven others.
Hurricane Nate
A tropical depression formed on September 5 south-southwest of Bermuda on September 5. It quickly intensified into Tropical Storm Nate, which moved slowly northeastward. On September 7, Nate intensified into the seventh hurricane of the season. A day later, the hurricane passed southeast of Bermuda, where it produced wind gusts of 50 mph (80 km/h). Early on September 9, Nate attained peak winds of 90 mph (140 km/h), before weakening due to an approaching trough. On September 10, Nate transitioned into an extratropical storm, which was absorbed by a larger extratropical storm near the Azores on September 13.
Canadian Navy ships headed to the U.S. Gulf Coast to help in the aftermath of Hurricane Katrina were slowed down trying to avoid Nate and Ophelia. Rip currents caused by hurricanes Nate and Maria killed one person in New Jersey and severely injured another person.
Hurricane Ophelia
Tropical Depression Sixteen formed over the northern Bahamas on September 6. The depression strengthened into Tropical Storm Ophelia on September 7 and briefly into a hurricane on September 9. Ophelia fluctuated between hurricane and tropical storm intensity for the next week as it meandered off the southeastern United States. Twice it attained peak winds of 85 mph (137 km/h). On September 14, the northern eyewall moved over the North Carolina coast from Wilmington to Morehead City. After moving away from the state, Ophelia weakened to tropical storm status due to stronger wind shear and dry air. The storm accelerated northeastward and passed southeast of Cape Cod. Ophelia transitioned into an extratropical storm on September 18 and subsequently crossed Nova Scotia and Newfoundland, eventually dissipating on September 23 north of the Scandinavian Peninsula.
Ophelia caused significant coastal erosion from the churning waves. The hurricane caused extensive damage in the Outer Banks and around Cape Fear. Damage in the United States was estimated at $70 million. The storm's remnants produced strong winds and heavy rain over Atlantic Canada. Ophelia killed three people – a drowning in Florida from high surf, a traffic fatality in North Carolina, and a death from a fall in Nova Scotia.
Hurricane Philippe
On September 17, Tropical Depression Seventeen formed from a tropical wave about 350 miles (560 km) east of Barbados. It quickly intensified into Tropical Storm Philippe while taking a track to the north-northwest. Early on September 19, Philippe attained hurricane status and reached peak winds of 80 mph (130 km/h) a day later. Wind shear from an upper-level low caused the hurricane to weaken back to a tropical storm, exposing the center from the convection. On September 21, Philippe accelerated to the north and began moving around the upper-level low, which had extended to the surface and developed into a non-tropical cyclone. The storm briefly threatened Bermuda as it turned to the northwest and began a counterclockwise loop. On September 23, Philippe weakened to a tropical depression and later a remnant low; it was absorbed by the larger non-tropical cyclone a day later.
Philippe brought gusty winds and moisture to Bermuda, with 0.15 inches (3.8 mm) of precipitation reported on September 23. The circulation that absorbed Philippe dropped light rainfall on the island, and was responsible for the lowest barometric pressure during the month.
Hurricane Rita
A tropical depression formed on September 18 near the Turks and Caicos Islands on September 18, and soon strengthened into Tropical Storm Rita. Moving to the west-northwest, Rita continued to intensify, becoming a hurricane on September 20 between Cuba and Florida. Rapid intensification ensued as Rita moved into the Gulf of Mexico. Late on September 21, Rita strengthened into a Category 5 hurricane, and the next day it attained peak winds of 180 mph (290 km/h). Its minimum pressure of 895 mbar (895 hPa; 26.4 inHg) was the lowest of any storm in the Gulf of Mexico on record, later being tied with Hurricane Milton in 2024. The hurricane weakened as it approached the northwest Gulf Coast. On September 24, Rita made landfall near the Texas–Louisiana border with sustained winds of 115 mph (185 km/h). It rapidly weakened over land as it turned to the north and northeast, and was later absorbed by an approaching cold front on September 26 over Illinois.
Across the United States, Rita imparted $18.5 billion in damage and killed 120 people, although only seven deaths were directly related to the hurricane. Early in its evolution, Rita flooded houses in northern Cuba and the Florida Keys. Rita's approach to the U.S. Gulf Coast prompted one of the largest mass evacuations in the country's history, with an estimated 3.7 million people fleeing the Texas coast between Corpus Christi and Beaumont. Due in part to high temperatures preceding Rita's landfall and elderly susceptibility to excessive heat, at least 80 people died during the mass evacuation; a coach fire en route to Dallas claimed 23 lives. Rita generated a 15-foot (4.6 m) storm surge that devastated parts of Cameron Parish in Louisiana, destroying most structures in towns like Cameron and Holly Beach. Storm surge also damaged homes in adjoining Jefferson County in Texas. In New Orleans, Rita produced additional flooding and overtopped levees that had been repaired after Hurricane Katrina a month earlier. Impacts from heavy rainfall, gusty winds, and tornadoes associated with Rita affected much of the lower Mississippi River Valley, and over a million electricity customers lost power. A third of Cameron Parish's population left the parish following the devastation wrought by Rita.
Tropical Depression Nineteen
On September 30, a tropical wave developed into Tropical Depression Nineteen to the west of Cabo Verde. The newly formed cyclone exhibited deep convection in the southern semicircle, but its cloud pattern quickly deteriorated under the influence of strong wind shear. The system moved northwestward and failed to intensify beyond winds of 35 mph (56 km/h), instead dissipating on October 2 without affecting land.
Hurricane Stan
A tropical depression formed southeast of Cozumel on October 1, and quickly strengthened into Tropical Storm Stan before hitting the Yucatan Peninsula. Stan weakened to a tropical depression over land, but soon re-intensified over water. Stan became a hurricane, attaining peak winds of 80 mph (130 km/h), before making a second landfall in the Mexican state of Veracruz early on October 4. Stan rapidly weakened over land, dissipating early on October 5.
Stan killed 80 people in Mexico, and damage in the county was estimated at US$1.2 billion ($13.2 billion MXN). Stan was associated with a larger weather system across eastern Mexico and Central America. Torrential rainfall across this region killed 1,513 people in Guatemala, making it the deadliest natural disaster in the country's history. Damage in Guatemala was estimated at US$996 million. El Salvador's Santa Ana Volcano erupted on October 1, occurring simultaneous to the flooding. The flooding killed 69 people in the country, and damage from the two disasters was estimated at US$355.6 million. In Honduras, the weather system killed seven people and left US$100 million in damage. There were also three deaths in Nicaragua and one in Costa Rica. Road damage in Costa Rica from Stan and earlier Hurricane Rita was estimated at US$57 million (₡28 billion (CRC).
Unnamed subtropical storm
On September 28, an upper-level low formed west of the Canary Islands and moved to the west-northwest. Two days later, the low spawned a surface trough along with scattered convection. Late on October 3, a surface low formed about 460 mi (740 km) southwest of São Miguel Island in the Azores. It organized into a subtropical depression early on October 4, based on the system's broad wind field. It turned to the northeast ahead of an approaching cold front, and soon strengthened into a subtropical storm. The storm reached peak winds of 50 mph (85 km/h) as it moved through the eastern Azores. Santa Maria Island reported wind gusts of 59 mph (94 km/h). Early on October 5, the storm merged with the cold front, and later that day, its remains were absorbed by a non-tropical low. The low that absorbed the storm would eventually become Hurricane Vince.
This system was not noted during the season. It was identified by the National Hurricane Center as a subtropical storm during post-season analysis.
Tropical Storm Tammy
On October 5, Tropical Storm Tammy developed east of Florida following the interaction of a tropical wave and an upper-level trough. That day, it strengthened to reach peak winds of 50 mph (80 km/h) and made landfall near Jacksonville, Florida. Tammy weakened as it moved inland, crossing southern Georgia and Alabama. It was absorbed by a larger extratropical storm on October 6. Tammy dropped locally heavy rainfall along its path, causing minor damage. The frontal system that absorbed Tammy was a partial cause for severe flooding in New York, New Jersey and New England that killed 10 people in mid-October.
Subtropical Depression Twenty-Two
A surface trough developed on October 6, partially aided by outflow from Tropical Storm Tammy. It organized enough to be classified Subtropical Depression Twenty-Two on October 8, about 450 miles (720 km) southeast of Bermuda on October 8. The NHC classified it subtropical due to the nearby presence of an upper-level low. The depression encountered strong wind shear, and it degenerated into a remnant low on October 10 about 175 mi (280 km) southwest of Bermuda. The low merged with a cold front on October 11, and over the next three days it meandered off the east coast of the United States. On October 14, a larger extratropical storm absorbed the former subtropical depression. The system produced heavy rainfall across the northeastern United States from October 14 to 16, reaching over 6 in (150 mm), just days after the region received rainfall from the remnants of Tropical Storm Tammy. Two people died in Connecticut after they were swept away by floods. About 500 people in Rhode Island required rescue, after the rains led to river flooding.
Hurricane Vince
Subtropical Storm Vince formed in the eastern Atlantic near Madeira on October 8 from the same non-tropical low that absorbed the unnamed subtropical storm. Vince transitioned into a tropical storm on the following day and was upgraded to a hurricane shortly thereafter. Although Vince was a very small and short-lived storm that only briefly reached hurricane strength, it was notable for developing in the northeastern Atlantic, well away from where hurricanes usually form. Vince made landfall on the Iberian Peninsula near Huelva, Spain, on October 11 just after weakening to a tropical depression. The storm left minor flooding in some areas.
Hurricane Wilma
A tropical depression formed on October 15 to the southwest of Jamaica. Moving slowly over the Caribbean, it intensified into Tropical Storm Wilma two days later. The storm began a period of rapid deepening on October 18 that lasted into the following day. This culminated in Wilma attaining Category 5 hurricane status, with peak winds of 185 mph (298 km/h). At 12:00 UTC on October 19, hurricane hunters recorded a pressure of 882 mbar (26.0 inHg), making Wilma the most-intense Atlantic hurricane on record. Wilma weakened to Category 4 intensity by the time it made landfall on Cozumel on October 21. It crossed the Yucatán Peninsula and emerged into the Gulf of Mexico, turning northeast. On October 24, Wilma made landfall in southwestern Florida at Cape Romano with winds of 120 mph (190 km/h). The hurricane quickly crossed the state and continued across the western Atlantic Ocean. Wilma transitioned into an extratropical cyclone on October 26, which was absorbed by a larger extratropical storm a day later over Atlantic Canada.
In its formative stages, Wilma's large circulation spread across much of the western Caribbean Sea, killing 12 people in Haiti and one in Jamaica. Wilma set a record in Mexico, and for the entire Western Hemisphere, for the highest 24 hour rainfall total, with 64.330 in (1,633.98 mm) recorded at Isla Mujeres. There were four deaths in Mexico, and nationwide damage was estimated at US$454 million ($4.8 billion MXN). On November 28, Mexico declared a disaster area for 9 of Quintana Roo's 11 municipalities. A significant storm surge flooded areas of western Cuba, leaving US$704 million in damage. In Florida, Wilma caused $19 billion in damage and killed 30 people; five of the deaths were caused directly by the hurricane. Wilma inflicted a multi-billion dollar disaster in the Miami metropolitan area, including $2.9 billion in damage in Palm Beach County, $2 billion in Miami-Dade County, and $1.2 billion in Broward County. Numerous homes and businesses experienced some degree of impact, with over 55,000 dwellings and 3,600 workplaces damaged in Palm Beach County alone. After leaving Florida, Wilma killed one person and left US$6.4 million in damage to the Bahamas, when it passed northwest of the country. On Bermuda, Wilma produced wind gusts of 51 mph (82 km/h).
Tropical Storm Alpha
Tropical Depression Twenty-Five formed in the eastern Caribbean on October 22 and quickly intensified into Tropical Storm Alpha as it moved west-northwestward. On the next day, the storm made landfall near Barahona, Dominican Republic, with winds of 50 mph (80 km/h). Alpha weakened to a tropical depression over Hispaniola's steep mountains. The cyclone emerged into the Atlantic Ocean, where it was absorbed by Hurricane Wilma on October 24. The storm claimed 26 lives, with more than half of them in Haiti. Alpha destroyed 43 homes and damaged 191 others in Haiti.
Hurricane Beta
Late on October 26, the same tropical wave that spawned Tropical Storm Alpha led to the formation of Tropical Depression Twenty-Six over the southwestern Caribbean Sea. Early the next day, it was upgraded to Tropical Storm Beta. The storm strengthened into a hurricane on October 29 and reached major hurricane intensity on October 30, with sustained winds around 115 mph (185 km/h). However, Beta weakened to a Category 2 prior to landfall in Nicaragua. The storm rapidly weakened inland and dissipated on October 31.
The Colombian island of Providencia was subjected to hurricane-force winds for several hours as the center of the storm moved very slowly by the island. Reports indicate extensive damage to homes and a loss of communications with the islanders. In Honduras and Nicaragua, over 1,000 structures were damaged by the storm, hundreds of which were destroyed. Overall, Beta caused nine fatalities and more than $15.5 million in damage across four countries.
Tropical Storm Gamma
A tropical depression formed late on November 13 about 115 mi (185 km) west-southwest of St. Lucia. While passing through the Lesser Antilles, the system produced heavy rainfall and mudslides, killing two people on Bequia in St. Vincent and the Grenadines. The depression briefly attained tropical storm status, but degenerated back into a tropical wave. On November 18, a new circulation formed off the north coast of Honduras, developing into Tropical Storm Gamma, with peak winds of 50 mph (85 km/h). Gamma meandered over the western Caribbean until degenerating into a remnant low on November 21. Floods from Gamma killed 34 people in Honduras. Three people died in Belize related to the storm. The storm caused 39 deaths in total.
Tropical Storm Delta
A non-tropical low formed in the open Atlantic on November 19, which developed thunderstorms over the center over the next few days. On November 22, the NHC classified it as Subtropical Storm Delta, and redesignated it as a tropical storm the next day. Delta moved to the south and stalled, becoming a strong tropical storm with peak winds of 70 mph (110 km/h) on November 24. It weakened as it accelerated to the east-northeast, and Delta transitioned into an extratropical storm on November 28. Shortly thereafter, the storm passed just north of the Canary Islands before Delta inland over northwest Africa, dissipating on November 29.
Delta caused severe damage in the Canary Islands and claimed at least seven lives, including six who drowned after boats overturned; there were 12 people missing from the overturned boat. El Dedo de Dios (lit. 'Finger of God'), a geological feature which had been pointing towards the sky for over a millennium and an important landmark for the Canary Islands, was toppled during the storm. Damage throughout the Canary Islands was estimated at €312 million (US$364 million). Delta also caused power outages, leaving some 200,000 people without power and forcing airports to close down. The remnants of Delta later moved into Morocco, bringing needed rain.
Hurricane Epsilon
A surface low attached to a stationary front formed underneath an upper-level low east of Bermuda on November 27. The surface low detached from the frontal zone and acquired tropical characteristics as deep convection wrapped around its center, leading to the development of Tropical Storm Epsilon early on November 29. The NHC consistently forecast that the storm would weaken; however, Epsilon gradually intensified as it moved westward and later looped to the northeast. The storm attained hurricane status on December 2 as the track shifted to the east. Neither Epsilon's structure or strength changed appreciably over the next few days, and it attained peak winds of 85 mph (137 km/h) on December 5. A building ridge turned Epsilon to the southwest on December 6, and it maintained its intensity due to low wind shear. Epsilon remained a hurricane until December 7. Epsilon degenerated into a remnant low on December 8; the circulation dissipated two days later.
Tropical Storm Zeta
Towards the end of December, an upper-level low interacted with a cold front, which produced an area of low-pressure by December 28, about 750 mi (1,205 km) to the west-northwest of Cabo Verde. Over the next couple of days, the system developed a low-level circulation and atmospheric convection increased as it moved north-westwards, before the NHC classified it as Tropical Storm Zeta during December 30. Over the next couple of days, the system gradually intensified further in a region of favorable anticyclonic outflow, as it slowly moved west-northwest in response to a mid-level low to the southwest. On January 1, Zeta peaked with 1-minute sustained winds of 65 mph (105 km/h). It weakened on January 2, only to re-intensify to its peak intensity on January 3. Zeta weakened again as it turned westward, degenerating into a remnant low on January 6; the circulation dissipated on the next day to the southeast of Bermuda. Zeta affected the 2005 Atlantic Rowing Race by producing high swells that moved boats off course.
Storm names
The following list of names was used for named storms that formed in the North Atlantic in 2005. This was the same list used for the 1999 season, with the exceptions of Franklin and Lee, which replaced Floyd and Lenny. The names Franklin, Lee, Maria, Nate, Ophelia, Philippe, Rita, Stan, Tammy, Vince and Wilma from the regular list were used for the first (and in the cases of Rita, Stan, and Wilma, only) time in 2005, as were the auxiliary list Greek letters Alpha, Beta, Gamma, Delta, Epsilon and Zeta. This was the first Atlantic hurricane season to exhaust the designated list of 21 storm names, and the first to utilize the auxiliary list.
Retirement
In the spring of 2006, the hurricane committee of the World Meteorological Organization (WMO) retired five names: Dennis, Katrina, Rita, Stan, and Wilma, from the Atlantic hurricane name lists, and they will not be used again. They were replaced with Don, Katia, Rina, Sean and Whitney for the 2011 season. This set a new record for the number of storm names retired from a single season, surpassing the previous record of four names, held by the 1955, 1995, 2004 seasons.
There was considerable discussion at that time on the usage of the Greek alphabet. The committee agreed that the usage of the Greek alphabet had a "major important political, economic and social impact globally, which might not have happened if a secondary or circular list of names had been used", and that the Greek alphabet would be used again if the traditional naming list was exhausted. It was also decided that it was not practical to retire a Greek letter. Storms named with Greek letters that would otherwise be eligible for retirement would appear in the retired name list, but have a notation affixed with the circumstances. However, when faced with retiring Eta and Iota following the 2020 season, when the Greek alphabet was next utilized, the WMO decided to discontinue its further use altogether. A new auxiliary list of given names was implemented, making any retirements less problematic.
Season effects
This is a table of all of the storms that formed in the 2005 Atlantic hurricane season. It includes their name, duration, peak classification and intensities, areas affected, damage, and death totals. Deaths in parentheses are additional and indirect (an example of an indirect death would be a traffic accident), but were still related to that storm. Damage and deaths include totals while the storm was extratropical, a wave, or a low, and all of the damage figures are in 2005 USD.