

Connectome
Comprehensive map of neural connections in the brain
- 15 min read
- 5 chapters

Related on Lably
Through Brain, Electron microscope and Cognition
The significance of the connectome stems from the realization that the structure and function of any brain are intricately linked, through multiple levels and modes of brain connectivity. There are strong natural constraints on which neurons or neural populations can interact, or how strong or direct their interactions are. Indeed, the foundation of human cognition lies in the pattern of dynamic interactions shaped by the connectome.
Despite such complex and variable structure-function mappings, connectomes are an indispensable basis for the mechanistic interpretation of dynamic brain data, from single-cell recordings to functional neuroimaging.
The terms connectome and connectomics were introduced independently by Olaf Sporns at Indiana University and Patric Hagmann at Lausanne University Hospital to refer to a map of the neural connections within the brain. This term was directly inspired by the ongoing effort to sequence the human genetic code—to build a genome. It was more recently popularized by Sebastian Seung's I am my Connectome speech given at the 2010 TED conference. In 2012, Seung published the book Connectome: How the Brain's Wiring Makes Us Who We Are.
Types of connectomes
Brain networks can be defined at different levels of scale, corresponding to levels of spatial resolution in brain imaging. These scales can be roughly categorized as macroscale, mesoscale and microscale. Ultimately, it may be possible to join connectomic maps obtained at different scales into a single hierarchical map of the neural organization of a given species that ranges from single neurons to populations of neurons to larger systems like cortical areas. Given the methodological uncertainties involved in inferring connectivity from the primary experimental data, and given that there are likely to be large differences in the connectomes of different individuals, any unified map will likely rely on probabilistic representations of connectivity data.
Macroscale
A connectome at the macroscale (millimeter resolution) attempts to capture large brain systems that can be parcellated into anatomically distinct modules (areas, parcels or nodes), each having a distinct pattern of connectivity. Connectomic databases at the mesoscale and macroscale may be significantly more compact than those at cellular resolution, but they require effective strategies for accurate anatomical or functional parcellation of the neural volume into network nodes.
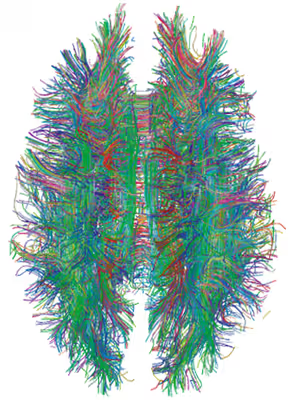
Established methods of brain research, such as axonal tracing, provided early avenues for building connectome data sets. However, more recent advances in living subjects has been made by the use of non-invasive imaging technologies such as diffusion-weighted magnetic resonance imaging (DW-MRI) and functional magnetic resonance imaging (fMRI). The first, when combined with tractography allows reconstruction of the major fiber bundles in the brain. The second allows the researcher to capture the brain's network activity (either at rest or while performing directed tasks), enabling the identification of structurally and anatomically distinct areas of the brain that are functionally connected.
Notably, the goal of the Human Connectome Project, led by the WU-Minn consortium, was to build a structural and functional map of the healthy human brain at the macro scale, using a combination of multiple imaging technologies and resolutions.
Initial attempts at connectivity mapping
Throughout the 2000s, several investigators have attempted to map the large-scale structural architecture of the human cerebral cortex. One attempt exploited cross-correlations in cortical thickness or volume across individuals. Such gray-matter thickness correlations have been postulated as indicators for the presence of structural connections. A drawback of the approach is that it provides highly indirect information about cortical connection patterns and requires data from large numbers of individuals to derive a single connection data set across a subject group. Other investigators have attempted to build whole-brain connection matrices from DW-MRI imaging data.
The Blue Brain Project attempted to reconstruct the entire mouse connectome using a diamond knife sharpened to an atomic edge, and electron microscopy for imaging tissue slices. They ended up in 2018 with an atlas providing information about major cell types, numbers, and positions in 737 regions of the brain.
Challenge for macroscale connectomics
The initial explorations in macroscale human connectomics were done using either equally sized regions or anatomical regions with unclear relationship to the underlying functional organization of the brain (e.g. gyral and sulcal-based regions). While much can be learned from these approaches, it is highly desirable to parcellate the brain into functionally distinct parcels: brain regions with distinct architectonics, connectivity, function, and/or topography. Accurate parcellation allows each node in the macroscale connectome to be more informative by associating it with a distinct connectivity pattern and functional profile. Parcellation of localized areas of cortex have been accomplished using diffusion tractography and functional connectivity to non-invasively measure connectivity patterns and define cortical areas based on distinct connectivity patterns. Such analyses may best be done on a whole brain scale and by integrating non-invasive modalities. Accurate whole brain parcellation may lead to more accurate macroscale connectomes for the normal brain, which can then be compared to disease states.
Pathways through cerebral white matter can be charted by histological dissection and staining, by degeneration methods, and by axonal tracing. Axonal tracing methods form the primary basis for the systematic charting of long-distance pathways into extensive, species-specific anatomical connection matrices between gray matter regions. Landmark studies have included the areas and connections of the visual cortex of the macaque and the thalamocortical system in the feline brain. The development of neuroinformatics databases for anatomical connectivity allow for continual updating and refinement of such anatomical connection maps. The online macaque cortex connectivity tool CoCoMac and the temporal lobe connectome of the rat are prominent examples of such a database.
Chemical connectome
Nerve cells communicate with adjacent cells through synapses and gap junctions, but they also communicate with distant cells via chemicals (typically neuropeptides) that diffuse through tissue and trigger receptors on cells far away. There are hundreds of such neuromodulators, with any given nerve cell emitting and responding to at most as few of them. The graph that describes these interactions is another form of connectome. The largest (and only, as of 2025), animal with a complete chemical connectome is C. elegans, although there is preliminary work in other animals.
Microscale (neural) connectome
Mapping the connectome at the "microscale" (micrometer resolution) means building a complete map of the neural systems, neuron-by-neuron. This is (barely) possible for small animals such as worms or flies (for example, see Drosophila connectome) but the challenge of doing this in more complex organisms becomes obvious: the number of neurons comprising the brain easily ranges into the billions. The human cerebral cortex alone contains on the order of 9×10¹⁰ neurons linked by 1014 synaptic connections. By comparison, the number of base-pairs in a human genome is 3×10⁹. A few of the main challenges of building a human connectome at the microscale today include: data collection would take years given current technology, machine vision tools to annotate the data remain in their infancy, and are inadequate, and neither theory nor algorithms are readily available for the analysis of the resulting brain-graphs. To address the data collection issues, several groups are building high-throughput serial electron microscopes. To address the machine-vision and image-processing issues, the Open Connectome Project is alg-sourcing (algorithm outsourcing) this hurdle. Finally, statistical graph theory is an emerging discipline which is developing sophisticated pattern recognition and inference tools to parse these brain-graphs.
Current non-invasive imaging techniques cannot capture the brain's activity on a neuron-by-neuron level, except for small animals that are optically transparent (such as Danionella and larval zebrafish). Mapping the connectome at the cellular level in larger vertebrates currently requires post-mortem (after death) microscopic analysis of limited portions of brain tissue. Non-optical techniques that rely on high-throughput DNA sequencing have been proposed by Anthony Zador (CSHL).
Traditional histological circuit-mapping approaches rely on imaging and include light-microscopic techniques for cell staining, injection of labeling agents for tract tracing, or chemical brain preservation, staining and reconstruction of serially sectioned tissue blocks via electron microscopy (EM). Each of these classical approaches has specific drawbacks when it comes to deployment for connectomics. The staining of single cells, e.g. with the Golgi stain, to trace cellular processes and connectivity suffers from the limited resolution of light-microscopy as well as difficulties in capturing long-range projections. Tract tracing, often described as the "gold standard" of neuroanatomy for detecting long-range pathways across the brain, generally only allows the tracing of fairly large cell populations and single axonal pathways. EM reconstruction was successfully used for the compilation of the C. elegans connectome, and has recently (as of 2025) been extended, using considerable application of time, money, and personnel, to the entire nervous system of fruit flies. However, applications to larger tissue blocks of entire nervous systems have traditionally had difficulty with projections that span longer distances.
In March 2011, the journal Nature published a pair of articles on micro-connectomes: Bock et al. and Briggman et al. In both articles, the authors first characterized the functional properties of a small subset of cells, and then manually traced a subset of the processes emanating from those cells to obtain a partial subgraph. In alignment with the principles of open science, the authors of Bock et al. (2011) have released their data for public access. The full resolution 12 terabyte dataset from Bock et al. is available at NeuroData. Independently, important topologies of functional interactions among several hundred cells are also gradually going to be declared.
In 2016, the Intelligence Advanced Research Projects Activity of the United States government launched MICrONS, a five-year, multi-institute project to map one cubic millimeter of rodent visual cortex, as part of the BRAIN Initiative. Though only a small volume of biological tissue, this project will yield one of the largest micro-scale connectomics datasets currently in existence.
Alternatives to EM for detailed connectomes
Alternative techniques for mapping neural connectivity at the cellular level offer significant new hope for overcoming the limitations of classical techniques and for compiling cellular connectome data sets. Using Brainbow, a combinatorial color labeling method based on the stochastic expression of several fluorescent proteins, Jeff W. Lichtman and colleagues were able to mark individual neurons with one of over 100 distinct colors. The labeling of individual neurons with a distinguishable hue then allows the tracing and reconstruction of their cellular structure including long processes within a block of tissue.
Another alternative approach to EM for to mapping connectivity was proposed in 2012 by Zador and colleagues. Zador's technique, called BOINC (barcoding of individual neuronal connections) uses high-throughput DNA sequencing to map neural circuits. Briefly, the approach consists of labelling each neuron with a unique DNA barcode, transferring barcodes between synaptically coupled neurons (for example using Suid herpesvirus 1, SuHV1), and fusion of barcodes to represent a synaptic pair. This approach has the potential to be cheap, fast, and extremely high-throughput.
In 2022, a new technique called LICONN combined hydrogel expansion with light microscopy (as opposed to electron microscopy) to generate neuron level connectomes. The chief advantages are cheaper equipment (optical vs EM microscopes), faster data acquisition, and multi-color labelling.
Sign in to keep reading
4 more chapters are free with a Lably account.
Plasticity of the connectome
At the beginning of the connectome project, it was thought that the connections between neurons were unchangeable once established and that only individual synapses could be altered. However, evidence suggests that connectivity is also subject to change, termed neuroplasticity. There are two ways that the brain can rewire: formation and removal of synapses in an established connection or formation or removal of entire connections between neurons.
Pathology
Connectomics have been used to assess brain states in both health and disease. Moreover, connectome-based methods have had an impact on planning or understanding therapeutic options, such as invasive and noninvasive brain stimulation procedures. In this context, the term 'connectomic surgery' was introduced in 2012, as a framework to define or refine surgical targets by identifying pathological brain circuits using neuroimaging techniques such as diffusion-imaging based tractography that are also leveraged for macroscale connectomics. Dysfunctional brain circuits are thought to mediate neurological or psychiatric symptoms in various disorders, and have also been referred to as 'oscillopathies', with the idea that aberrant oscillations unfold along brain circuits, carrying meaningless noise, instead of meaningful information flow throughout the brain. Once identified, dysfunctional circuits may be lesioned by means of ablative neurosurgery or disrupted by means of deep brain stimulation. The (hypothetical) complete library that maps dysfunctional circuits onto specific neurological or psychiatric symptoms has been termed the 'dysfunctome' of the human brain, which could be iteratively mapped and used to inform interventional brain circuit therapeutics.
Model organisms and datasets
For macroscacle connectomes, the most common research subject is the human. For microscale connectomes, the most common subjects are the nematode C. elegans, the fruit fly, the mouse, and the barn owl.
Human
The Human Connectome Project (HCP) was an initiative launched in 2009 by the National Institutes of Health (NIH) to map the neural pathways that underlie human brain function. The goal was to obtain and distribute information regarding the structural and functional connections within the human brain, improving imaging and analysis methods to enhance resolution and practicality in the realm of connectomics. By understanding the wiring patterns within and across individuals, researchers hope to unravel the electrical signals that give rise to our thoughts, emotions, and behaviors. Additional programs within the Connectome Initiative, such as the Lifespan Connectome and Disease Connectome, focus on mapping brain connections across different age groups and studying connectome variations in individuals with specific clinical diagnoses. The Connectome Coordination Facility serves as a centralized repository for HCP data and provides support to researchers. The success of this project has opened the door to understanding how connectomics might be influential in other areas of neuroscience. The potential of a "Connectome II" project has been referenced recently, which would focus on developing a scanner designed for high-throughput studies involving multiple subjects. The project would aim to utilize recent advancements in visualization technologies towards a higher spatial resolution in imaging structural connectivity. Advancements in this area might also involve incorporating wearable mobile technology to acquire various types of behavioral data, complementing the neuroimaging information gathered by the scanner.
Small animals
Caenorhabditis elegans., commonly referred to as C. Elegans, is a small (<1 mm) nematode (or roundworm). It has a very small nervous system with 302 neurons and about 5000 synaptic connections (as compared, say, to the human brain which has 100 billion neurons and more than 100 trillion synapses). It was the first animal with a fully reconstructed synaptic connectome, and as of 2025 is the only animal with a known chemical (neuropeptide) connectome.
The C. elegans connectome reconstruction began with manual annotation of electron micrographs, published by White, Brenner et al., in 1986. Based on this seminal work, the first ever connectome (then called "neural circuitry database" by the authors) for C. elegans was published in book form with accompanying floppy disks by Achacoso and Yamamoto in 1992. The very first paper on the computer representation of its connectome was presented and published three years earlier in 1989 by Achacoso at the Symposium on Computer Application in Medical Care (SCAMC). The C. elegans connectome was later revised.
The small size of the nervous system of C. elegans has allowed studies that would be difficult or impractical in larger organisms. These include changes during the animal's development., variability between individuals, both at the level of synapse and connection, despite an invariant cell lineage and changes during development and aging. Researchers found the biggest change with age is the wiring circuits, and that connectivity between and within brain regions increases with age. Other studies have combined the connectome with behavior, environmental influences, and other available information to study the connection between neuroanatomy and behavior, and suggested comparing the connectome to that of other animals, once available.
Two other small animals with complete connectomes are the larvi of the ascidian Ciona intestinalis (177 CNS neurons, 6618 synapses including 1772 neuromuscular junctions and 1206 gap junctions) and Platynereis dumerilii (2728 neurons, 25,509 synapses).
Fruit fly
Drosophila connectomics started in 1991 with a description of the circuits of the lamina. However the methods used were largely manual and further progress awaited more automated techniques. In 2011, a high-level connectome, at the level of brain compartments and interconnecting tracts of neurons, for the full fly brain was published, and is available online. New techniques such as digital image processing began to be applied to detailed neural reconstruction. Reconstructions of larger regions soon followed, including a column of the medulla, also in the visual system of the fruit fly, and the alpha lobe of the mushroom body. In 2020, a dense connectome of half the central brain of Drosophila was released, along with a web site that allows queries and exploration of this data. The methods used in reconstruction and initial analysis of the 'hemibrain' connectome followed. In 2023-2024, the connectome of 139,255 neurons in the adult female D. melanogaster central brain, without the VNC, was obtained, reconstructed and published.
There are also currently two publicly available datasets of the adult fly ventral nerve cord (VNC). The female adult nerve cord (FANC) was collected using high-throughput ssTEM by Wei-Chung Allen Lee's lab at Harvard Medical School. and was further reconstructed in 2024. The male adult nerve cord (MANC) was reconstructed soon after. In addition, the connectome of a complete central nervous system (connected brain and VNC) of a 1st instar D. melanogaster larva has been reconstructed as a single dataset of 3016 neurons.
Progress is still on-going - as of 2025, two teams have reported complete adult CNS connectomes that includes both the brain and the VNC, in both male and female flies.
Mouse
Partial connectomes of a mouse retina and mouse primary visual cortex are available. The first full connectome of a mammalian circuit (not the whole brain) was constructed in 2021. This construction included the development of all connections between the central nervous system and a single muscle from birth to adulthood.
An online database known as MouseLight displays over 1000 neurons mapped in the mouse brain based on a collective database of sub-micron resolution images of these brains. This platform illustrates the thalamus, hippocampus, cerebral cortex, and hypothalamus based on single-cell projections. Imaging technology to produce this mouse brain does not allow an in-depth look at synapses but can show axonal arborizations which contain many synapses. A limiting factor to studying mouse connectomes, much like with humans, is the complexity of labeling all the cell types of the mouse brain; this is a process that would require the reconstruction of 100,000+ neurons and imaging technology is not yet advanced enough to do so.
Some portions of the technology needed to scale ultrastructural circuit mapping to the whole mouse brain are under investigation. However, the mouse brain is about 10,000 times bigger than the Drosophila brain, the largest reconstructed as of 2025. A mouse connectome will therefore require non-trivial advances in connectivity mapping.
Eyewire game
Eyewire is an online game developed by American scientist Sebastian Seung of Princeton University. It uses social computing to help map the connectome of the brain. It has attracted over 130,000 players from over 100 countries.