


Related on Lably
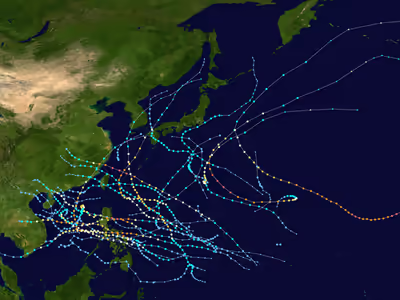
China was hit by several storms, with Tropical Storm Bilis and Typhoon Saomai being the most notable. Bilis became the costliest and second-deadliest typhoon of the season, causing $4.4 billion (2006 USD) in damages and killing at least 800 people. Saomai became the most powerful typhoon to strike the country in 50 years, and was responsible for 456 deaths and $2.5 billion worth of damages. The Philippines got hit by a total of six typhoons – the highest since 1974 – the most significant being Typhoons Xangsane and Durian. Xangsane was the strongest to affect Manila in 11 years, while Durian became the deadliest typhoon of the season, causing at least 1,000 fatalities. Meanwhile, Japan also had its share of destructive typhoons; Typhoon Shanshan hit the country in mid-September, resulting in 11 deaths and damages amounting to $2.5 billion. This season also featured Typhoon Ioke, the strongest Central Pacific hurricane, which also entered the basin and hit Wake Island; damages were estimated to be at $88 million.
The scope of this article is limited to the Pacific Ocean to the north of the equator between 100°E and 180th meridian. Within the northwestern Pacific Ocean, there are two separate agencies that assign names to tropical cyclones which can often result in a cyclone having two names. The Japan Meteorological Agency (JMA) will name a tropical cyclone should it be judged to have 10-minute sustained wind speeds of at least 65 km/h (40 mph) anywhere in the basin, whilst the Philippine Atmospheric, Geophysical and Astronomical Services Administration (PAGASA) assigns names to tropical cyclones which move into or form as a tropical depression in their area of responsibility located between 135°E and 115°E and between 5°N–25°N regardless of whether or not a tropical cyclone has already been given a name by the JMA. Tropical depressions that are monitored by the United States' Joint Typhoon Warning Center (JTWC) are given a number with a "W" suffix.
Seasonal forecasts
During the year several national meteorological services and scientific agencies forecast how many tropical cyclones, tropical storms, and typhoons will form during a season and/or how many tropical cyclones will affect a particular country. These agencies included the Tropical Storm Risk (TSR) Consortium of University College London, PAGASA and Taiwan's Central Weather Bureau. Some of the forecasts took into consideration what happened in previous seasons and the La Niña conditions that were observed during the previous year.
On March 7, Tropical Storm Risk issued its first forecast for the season at an extended-range, forecasting a close to average season of 27 tropical storms, 17 typhoons and 8 intense typhoons. The ACE predicted was around 298. By May 5, Tropical Storm Risk issued their second forecast for the season, raising their numbers to 29 tropical storms, 19 typhoons and 9 intense typhoons, with an ACE of 326. This is due to the observed warming of sea-surface temperatures in the Niño 3.75 region and current patterns within the Central Pacific, indicating slightly higher activity. TSR released its third forecast for the season on June 7, predicting the same numbers with the same reason. Though on their fourth forecast during July 5, TSR stated that the 2006 season will be 15% above the 1965–2005 norm. Therefore, they raised the number of intense typhoons to 10, and their ACE to 349. The other reason behind this is due to the fact that there was an increase in tropical activity and much warmer SSTs over in the Niño 3.75 region than the previous forecast. On August 4, TSR released their final forecast. They reduced the number of intense typhoons to 9, and the ACE to 325. This was because it was reported that a slight decrease in tropical activity from the previous forecast and is due solely of a slight decrease in SSTs over in the same region.
Sign in to keep reading
4 more chapters are free with a Lably account.
Seasonal summary
The accumulated cyclone energy (ACE) index for the 2006 Pacific typhoon season as calculated by Colorado State University using data from the National Hurricane Center was 321.3 units. Broadly speaking, ACE is a measure of the power of a tropical or subtropical storm multiplied by the length of time it existed. It is only calculated for full advisories on specific tropical and subtropical systems reaching or exceeding wind speeds of 39 mph (63 km/h).
The Pacific typhoon season runs throughout 2006 and has no official bounds, though most tropical cyclones from this basin generally develops from the months from May through to October. Despite the season turned out to be active, most tropical cyclones developed during the second half of the year, with only one typhoon, Chanchu developing during the month of May. Some minor systems also developed before May, with the first tropical system of the year, Agaton, developing to the east of Philippines on January 20, bringing minor damages as it crossed the country few days later.
Tropical cyclogenesis had become much favorable during late June with formations of Jelawat and Ewiniar. It was also during the same time when NOAA had stated that the weak 2006–07 El Niño had started. From mid July to early August, three "back-to-back" storms made landfall over in China, which were Bilis, Kaemi and Prapiroon. With all three combined, more than 900 people have been killed and damages were reported more than US$5 billion. Shortly thereafter, environments throughout most of the basin became favorable with less shear, more convection and warmer water, as three simultaneous storms, Maria, Saomai and Bopha, formed and affected three different landmasses such as Japan, China and Taiwan, respectively. Later in the same month, Hurricane Ioke had entered the basin from the Central Pacific as the strongest Central Pacific storm in recorded history, as a Category 5 powerful storm.
On September, an unnamed and unclassified tropical storm have been discovered by meteorologist Gary Padgett and Dr. Karl Hoarau. Later, Typhoon Xangsane affected Luzon, Philippines, causing major damages with more than 200 people dead. The country saw four storms making landfall, with three of them reaching Category 4 or 5 super typhoon status. Typhoon Cimaron made landfall over in northern Luzon as a Category 5 super typhoon with minimal damages. By November, Typhoon Chebi made landfall in the same area as Cimaron, though effects from the typhoon were much smaller than Cimaron. Although by late November, Typhoon Durian made landfall in Bicol region. Combined effects with ash from the Mayon Volcano had killed over 1,500 people and damages at least US$530 million. Durian also crossed the basin and into the North Indian Ocean basin, the first time since 2003. During early December, two systems formed. Typhoon Utor crossed Visayas with minimal damage; and Tropical Storm Trami, a very weak system that didn't affect any landmasses became the final tropical cyclone and dissipated on December 20.
Systems
Tropical Depression Agaton
On January 20, the JMA began monitoring a minor tropical depression located about 555 km (345 mi) east of Mindanao in the southern Philippines. As it traveled in an erratic northwestward direction, it slowly became better organized. On January 23, the JMA assessed the storm to have attained winds of 55 km/h (34 mph) 10-minute winds). Around the same time, PAGASA began issuing advisories on the system and gave it the local name Agaton. The depression weakened as it crossed over northern Samar Island and southern Luzon. Traveling towards the west, the system failed to strengthen and dissipated on January 27 while located over the South China Sea, about halfway between Vietnam and Borneo.
Tropical Depression 01W (Basyang)
On March 4, a tropical depression formed out of a wave close to the equator southeast of Palau. The JTWC upgraded it to Tropical Storm 01W at 3 p.m. UTC the same day. The JTWC downgraded it back to a depression on March 5 due to shear, and it never regained tropical storm strength before dissipating on March 7.
Typhoon Chanchu (Caloy)
On May 8, the JMA started to track a tropical depression about 175 km (109 mi) northeast of Palau, and later the JTWC followed suit giving the designation of 02W. By the next day, 02W had intensified into a tropical storm, with the JMA naming it Chanchu. The PAGASA had also declared that Chanchu had entered their area, giving the local name Caloy. Chanchu reached typhoon intensity and made its first landfall over in Samar on May 11, and several hours later, it struck Mindoro at Category 2 typhoon intensity. As Chanchu emerged to the South China Sea, and moved northward, the storm explosively intensified into a Category 4 typhoon and reached peak intensity with 10-minute sustained winds of 175 km/h (110 mph) on May 15. By May 17, Chanchu rapidly weakened, becoming a severe tropical storm as it made its landfall over in Shantou, Guandong. Both the JMA and the JTWC would issue its final advisories on May 18 as it became extratropical.
In the Philippines, the storm caused 41 deaths and a total of ₱117.6 million (US$2.15 million) in damage. Though Chanchu didn't made landfall over in Vietnam, several ships sunk and were lost. A total of 18 people, who are fishermen, were dead. Chanchu is also the most intense typhoon on Hong Kong Observatory's record to enter the South China Sea in May. Chanchu necessitated the Strong Wind Signal no. 3 in both Hong Kong and Macau. In Hong Kong, the Gale force signal 8 should have been hoisted for at least 10 hours as sustained gales were affecting the Eastern part of the territory, where the hourly mean wind reached 83 km/h, with gust reaching over 100 km/h in some areas. Overall damage in China was at ¥7 billion (US$872 million).
Tropical Storm Jelawat (Domeng)
On June 24, the JMA started to track a weak tropical depression located to the southeast of Samar, Visayas. After crossing the archipelago and emerging into the South China Sea on June 26, PAGASA named it Domeng while the JTWC had started issuing advisories with the designation of 03W. Moving northwestward, 03W had entered in an area of favorable environments and intensified into a tropical storm, with the naming of Jelawat on June 27. Jelawat made landfall over Southern China and fully dissipated inland on June 29.
The storm dropped heavy rainfall across southern China and Haikou recorded a rainfall of 309.7 mm (12.19 in) during the storm passage. A total of 8.6 inches (220 mm) rain fell in 16 hours in Kampung Bundu, Malaysia. The rainfall killed seven people and left one missing. The flooding from Jelawat ruined 200 square kilometres of farmland and destroyed 190 houses.
Typhoon Ewiniar (Ester)
On June 29, a persistent tropical disturbance was classified as a tropical depression by the JTWC while east of Palau. The depression moved northwestward and was upgraded to Tropical Storm 04W by the JTWC on June 30. The JMA designated the storm Tropical Storm Ewiniar at around the same time. The name "Ewiniar" was submitted by the Federated States of Micronesia, and refers to a traditional storm god of Chuuk.
Ewiniar was responsible for at least 30 deaths in China, which it brushed as a typhoon. The typhoon gradually weakened as it moved over colder waters, and made landfall in South Korea on July 10 as a severe tropical storm. As Ewiniar moved across the country, it passed within 30 miles (48 km) of Seoul. The storm brought heavy rain that triggered floods and mudslides in the southern part of the country, killing at least six people. Ewiniar became extratropical over the Sea of Japan on the same day.
Severe Tropical Storm Bilis (Florita)
A tropical disturbance northeast of Yap developed sufficient convection to be designated a tropical depression on July 8. The depression strengthened into a tropical storm the next day, and was designated Tropical Storm Bilis by the JMA. The word "Bilis", submitted by the Philippines, means speed or swiftness. PAGASA operationally treated this storm as a typhoon for a short time on July 13, but it officially remained a tropical storm as it moved west-northwestward toward Taiwan. After moving over northern Taiwan, Bilis made landfall in Fujian, China at 12:50 p.m. CST on July 14, weakening into a tropical depression inland the next day. JMA carried the system as a tropical depression until July 17. Bilis brought very heavy rain, widespread flooding, landslides, and strong winds to the Philippines, Taiwan and areas of mainland China, causing 672 deaths and $4.4 billion (2006 US$) in damage.
Typhoon Kaemi (Glenda)
A tropical depression formed on July 18 near the Caroline Islands, it quickly strengthened to tropical storm strength the same day. On July 19, the storm was named Kaemi by the JMA. The correct name Gaemi was submitted by South Korea and is a Korean word for ant. It strengthened into a severe tropical storm on July 20, and further deepened into a typhoon 24 hours later. Kaemi made landfall in Jinjiang, Fujian at 3:50 p.m. CST on July 25 as a minimal typhoon.
Heavy rainfall in Taiwan caused flooding and four minor injuries. Rain also fell heavily in the northern Philippines. The storm has also killed at least 32 people in China, while another 60 people are missing. Agricultural losses in Taiwan amounted to NT$73 million (US$2.2 million). Total damages from the storm amounted to $450 million.
Typhoon Prapiroon (Henry)
A tropical disturbance developed west-southwest of Yap on July 2. It was upgraded into a tropical depression by the JMA on July 27. PAGASA later named the system as Tropical Depression Henry later that same day. The JTWC upgraded this system to a tropical storm on the morning of August 1. Hong Kong Observatory also did so and issued the Tropical Cyclone Signal No. 1 that same afternoon, and shortly after the JMA upgraded the system to Tropical Storm Prapiroon. The name Prapiroon was submitted by Thailand and is the name of a Thai rain deity. The JMA upgraded the storm to a severe tropical storm on the morning of August 2. PAGASA ceased advisories on the storm shortly after as it moved out of its area of responsibility. The JTWC and the HKO upgraded Prapiroon to a typhoon at 3 a.m. UTC, while the JMA officially upgraded it to a typhoon at 12 p.m. UTC (8 p.m. HKT). Prapiroon necessitated the first Tropical Cyclone Signal No. 8 in Macau this year. In Hong Kong, the flag raising ceremony at the Golden Bauhinia Square was cancelled due to strong wind. Prapiroon made landfall at 7:20 p.m. CST on August 3.
The strong winds due to the storm resulted in 70% of flights being cancelled, delayed or diverted in the Hong Kong International Airport, the highest since the opening in 1999. However, the airport remained open throughout the storm passage and many flights successfully landed or took off on August 3. Inbound flights were rerouted to nearby airports and outbound flights were cancelled or postponed. On landfall in Guangdong province, China, it forced the evacuation of some 660,000 people and caused an estimated 5.4 billion Chinese yuan worth of damage. 77 people were reported killed. It also affected Hunan, Guangxi and Hainan. Prapiroon degenerated into an area of low pressure on August 6.
Typhoon Maria
Maria formed out of a tropical depression over the open waters of the western Pacific Ocean. On August 5, the JMA classified the depression as a tropical storm while the JTWC kept it as a depression. The storm quickly strengthened into a typhoon the next day, reaching its peak intensity with winds of 130 km/h (80 mph) early on August 6. The storm gradually weakened as it began to recurve, causing it to parallel the southeastern coast of Japan. On August 9, Maria weakened into a tropical depression and later into an extratropical cyclone before dissipating on August 15. Maria had only minor effects in Japan, mainly heavy rains which were estimated to have peaked over 400 mm (16 in) on the Izu Peninsula. One person was killed after being struck by lightning and six others were injured.
Typhoon Saomai (Juan)
The JTWC identified a tropical depression near the Caroline Islands late on August 4 UTC. The JMA designated it as such at 12 a.m. UTC August 5. Nine hours later, the JTWC upgraded Tropical Depression 08W to a tropical storm, three hours before the JMA named it Saomai. The name is from the Vietnamese "sao Mai", meaning "Morning Star", a reference to the planet Venus.
The JTWC designated it a typhoon at 3 p.m. UTC August 6. The JMA upgraded Saomai to a Severe Tropical Storm at 6 p.m. UTC, and as it continued to strengthen, it was upgraded to a typhoon just 12 hours later. Saomai passed into the Area of Responsibility of PAGASA on August 8 and was named Typhoon Juan by PAGASA. On August 8, the storm underwent explosive development, and by August 9 it had become a Category 5-equivalent super typhoon.
Saomai made landfall in Zhejiang, China on August 10 with maximum sustained winds of 115 knots (1-minute mean), stronger than Chanchu earlier this season. Saomai was responsible for at least 458 deaths, mostly in China, and $2.5 billion (2006 USD) in damage.
Severe Tropical Storm Bopha (Inday)
The JMA identified a tropical depression in the open Pacific on August 5. PAGASA named this storm late on August 5 as it was forecast to enhance the southwest monsoon and bring rains to the Philippines. Around 1800 UTC, the JTWC declared that the system had developed into a tropical depression and gave it the number 10W. JMA upgraded it to Tropical Storm Bopha on August 6. The name Bopha was submitted by Cambodia and is a flower and girls' name. Around this time, the JTWC also upgraded the system to a tropical storm.
The JTWC recognised its existence as a tropical depression at 9 a.m. UTC the same day before upgrading it to a tropical storm at 3 p.m. UTC. The JMA then upgraded it to a severe tropical storm as it slowly churned westwards at 12 a.m. UTC August 7 before downgrading it 18 hours later. Bopha unexpectedly restrengthened into a severe tropical storm at 3 a.m. UTC August 8, before weakening back to a tropical storm at 12 p.m. UTC.
Bopha later made landfall on Taiwan at about 2 a.m. local time on August 9. At this time, the JTWC reported that Bopha attained winds of 100 km/h (60 mph). Tropical Storm Bopha then weakened into a tropical depression before degenerating into a remnant low on August 10.
The outer bands of Bopha produced heavy rains over northern Luzon, triggering flooding that destroyed 1,200 homes and killed seven people. Two of the fatalities occurred after a home was destroyed by a landslide in Kalinga Province. The landslide damaged 20 other homes, a church and a school.
As Bopha approached the island on August 8, the meteorological agency in Taiwan issued land and sea warnings for most of the region. Residents were warned about the possibility of torrential rains, flooding and mudslides. Although the storm was forecast to directly impact the island, all businesses remained open and schools were not closed. In Hong Kong, the Hong Kong Observatory issued Standby Signal number one as Bopha came within 800 km (500 mi) of the city on August 9. This signal was later discontinued on August 11.
Between August 9 and 10, the remnants of Bopha produced moderate rainfall around Hong Kong, peaking at 45.6 mm (1.80 in). Wind gusts up to 110 km/h (70 mph) were also produced by the storm throughout the city. A storm surge of 0.48 m (1.6 ft) was recorded in Tai Po Kau on August 8.
Severe Tropical Storm Wukong
Tropical Depression 11W formed south of Iwo Jima on August 12. Early on August 13, as it moved to the north-northwest, the JTWC upgraded it to a tropical storm. The JMA named it Wukong later that day. Wukong was submitted by People's Republic of China, and it is the name of a character in a Chinese epic. Wukong absorbed Tropical Storm Sonamu shortly before landfall in Japan. Wukong then stalled over Kyūshū, before starting to jog to the north-northwest. It was downgraded to a tropical depression on August 20.
In post-operational analysis by the JMA, Wukong was upgraded to a severe tropical storm.
Tropical Storm Sonamu (Katring)
On August 13, a tropical depression formed south of Naha, Okinawa, and was named Katring by PAGASA and Sonamu by JMA. The name Sonamu was submitted by DPR Korea and signifies a pine tree. Sonamu began interacting with nearby Tropical Storm Wukong on August 15, with the outflow from the stronger Wukong producing unfavourable shear over the cyclone. The JMA declared the system a tropical depression and stopped issuing advisories on August 16. The JTWC followed shortly after.
Tropical Depression 13W
In the afternoon of August 23, the China Meteorological Administration declared the formation of a tropical depression near Hainan. Hong Kong Observatory followed later that afternoon. The depression necessitated Tropical Cyclone Signal No.1 in Hong Kong and Macau, which means that the centre of a tropical cyclone is within 800 km (500 mi) of the respective Special Administrative Regions, and may later affect them. The depression made landfall at Guangdong at 5:55 a.m. CST on August 25 and dissipated later that morning.
The JTWC designated the system as a Tropical Depression at 9 p.m. UTC August 24, but only issued two warnings on the system.
Typhoon Ioke
On August 27, Hurricane Ioke, which had formed in the Central Pacific, crossed the International Date Line and entered the Japan Meteorological Agency's Area of Responsibility at around 6 a.m. UTC, keeping its name while being reclassified as Typhoon Ioke. Ioke had earlier affected Johnston Atoll. On August 31 the center of the typhoon passed very close to Wake Island; 200 people were evacuated from there in advance of its approach. Typhoon Ioke then passed just to the northeast of Minami Torishima, which had been evacuated ahead of the storm, but as a weakened Category 3-equivalent typhoon. Ioke then turned to the northeast, weakening as it started undergoing extratropical transition. The JMA released its final advisory on September 7. The extratropical remnants of Ioke moved into the Bering Sea where it caused severe beach erosion along the western Alaskan coastline.
Unnamed tropical storm
In early September, a tropical disturbance developed near Wake Island and gradually developed. Though never officially warned upon by any agency, meteorologist Gary Padgett and Dr. Karl Hoarau of Cergy-Pontoise University surmised that the system likely was a tropical cyclone. Dr. Hoarau estimated that the system became a tropical depression early on September 5 and tracked north-northeast, attaining tropical storm intensity 18 hours later. Around that time, the system featured a well-defined low-level circulation, significant convection wrapping around the circulation, and excellent outflow. Additionally, a QuikScat pass revealed estimated surface winds of 95 km/h (60 mph). Around the time Dr. Haorau classified it a tropical storm, the JTWC issued a Tropical Cyclone Formation Alert and their satellite intensity estimates reached T2.5, indicating a minimal tropical storm. On September 6, the system began to weaken as it turned north-northwest. Convection became intermittent, flaring around the circulation, and Dr. Haorau estimated it weakened to a depression later that day. Continuing northward, the system moved into a region of cooler waters and higher wind shear, inhibiting redevelopment. By September 9, the system became more extratropical in nature and was last noted by the JTWC at that time.
Typhoon Shanshan (Luis)
Hong Kong Observatory identified a tropical depression about 460 kilometres north of Yap on September 9, the same day the JMA recognised it. The JTWC declared the formation of Tropical Depression 14W the next day. On the afternoon of September 10, it entered the PAGASA AOR and was named Luis. Later at 12 p.m. UTC on the same day, the JMA upgraded the tropical depression to Tropical Storm Shanshan. The name Shanshan was contributed by Hong Kong and is a girls' name. Shanshan quickly strengthened and was upgraded into a severe tropical storm on September 11 and a typhoon later that day. Shanshan weakened slightly on September 14, but quickly restrengthened and reached Category 4 status on the JTWC's scale. Shanshan passed through the Yaeyama Islands in the early morning hours of September 16. The JTWC reported that Shanshan was becoming extratropical early on September 17, as the typhoon weakened to a tropical storm. The JTWC issued its final advisory on Shanshan later that day, and the JMA issued its last advisory on September 18, after Shanshan completed extratropical transition.
As Shanshan neared Taiwan, the Central Weather Bureau and local officials warned of flooding and high winds. However, as Shanshan turned towards Japan, all warnings were cancelled. South Korean forecasters also issued warnings ahead of an expected landfall, but this did not materialise. Ships were diverted as ports were closed as a precaution, while some other boats were forced to remain docked. In Japan, more than 90,000 people were evacuated from Yamaguchi Prefecture.
Over 200 people were injured by Shanshan and 11 people were killed, mostly in Kyūshū, although two deaths were reported in South Korea. A tornado spawned by the typhoon caused a train derailment in Nobeoka, Miyazaki, Japan which caused no fatalities. Peak gusts on Iriomote reached 155 mph (250 km/h). Flights and trains were delayed, while electricity was cut to about 3000 homes in Korea. A ship also sank off Ulleungdo.
Tropical Depression 15W
Hong Kong Observatory identified a tropical depression about 360 kilometres east-northeast of Xisha on September 12 and issued Standby Signal No.1 accordingly. The tropical depression also necessitated the issuance of the Standby Signal No. 1 in Macau at 2 p.m. UTC on the same day. The JTWC designated it as a tropical depression, 15W, at 9 p.m. UTC September 12. The JMA had earlier already identified it as a tropical depression. As it strengthened and edged closer to the coastal areas of Guangdong, the Strong Wind Signal No. 3 was issued both in Hong Kong and Macau on September 13. It made landfall in western Guangdong around 11:30 p.m. CST that night and dissipated inland.
Typhoon Yagi
On September 16, the Japan Meteorological Agency (JMA) began monitoring a tropical depression approximately 1,270 km (790 mi) east-northeast of Guam. Under low to moderate wind shear, convection was burst along the eastern portion of the system, prompting the Joint Typhoon Warning Center (JTWC) to issue a Tropical Cyclone Formation Alert later that day. Early on September 17, the JTWC began issuing advisories on Tropical Depression 16W. The storm executed a clockwise loop due to weak steering environment while quickly strengthening. Several hours later, the JMA upgraded the system to a tropical storm and gave it the name Yagi; Late on September 18, the JMA upgraded Yagi to a severe tropical storm while the JTWC classified the storm as a minimal typhoon. Early on September 19, the JMA upgraded Yagi to a typhoon. After completing the loop, Yagi's track was influenced by a subtropical ridge located southeast of Japan. The typhoon continued to intensify and reached its peak intensity on September 21 with 10-minute sustained winds of 195 km/h (120 mph) and a minimum barometric pressure of 910 hPa (26.87 inHg), making it the strongest storm of the season according to the JMA. At the same time, the JTWC classified Yagi as a Category 5 super typhoon with one-minute sustained winds of 260 km/h (160 mph). On September 22, Yagi passed Iwo Jima and Chichijima as the storm recurved to the northeast. With increasing wind shear, the typhoon began to weaken and also began to undergo an extratropical transition. Late on September 24, the JTWC classified the storm as an extratropical cyclone and issued their final advisory. The JMA kept Yagi as a tropical system for another day as it weakened to a severe tropical storm. Early on September 25, they classified it as extratropical. The remnants of Yagi continued moving northeastward and crossed the International Date Line on September 27.
On September 23, Typhoon Yagi passed directly over the resort island of Chichijima which has a population of about 2,000. The cyclone brought winds up to 210 km/h (130 mph), making it the strongest typhoon in 20 years to hit the island. About 1,000 of the 1,270 homes were without power during the height of the storm. About 150 residents evacuated to local shelters during the storm to escape the high winds and heavy rains. At least one structure was destroyed and numerous others sustained damage. The storm reportedly produced torrential rains, but there are no known measurements. Several homes had their roofs blown off and windows broken. Street lamps were knocked down by the strong winds produced by Yagi. Ferry service for several ports was cancelled for 29 days following the typhoon. Fallen trees knocked down power lines and cut communications. Some homes were reported to have lost water pressure also. The storm passed close to Iwo Jima on September 22, with the island being within the range of 95 km/h (59 mph) winds. No loss of life or injuries were related to Typhoon Yagi.
Tropical Depression 17W (Storm No. 5)
NCHMF, a meteorological agency in Vietnam, recorded this cyclone as reaching tropical storm strength and officially named it Bão số 5 (Storm No. 5). A weather station in Hà Tĩnh recorded sustained winds of 86 km/h (54 mph) and gusts of up to 108 km/h (67 mph). The total rainfall as of 19:00 (UTC+7) on September 26 was generally between 100–200mm, with amounts ranging from 200–300mm in areas from Quảng Bình to Danang; some areas recorded even higher rainfall. The storm has caused the deaths of 13 people and left 4 others missing.
Typhoon Xangsane (Milenyo)
On September 25, the Philippine Atmospheric, Geophysical and Astronomical Services Administration (PAGASA) named an active low-pressure area within its area of responsibility Tropical Depression Milenyo. After issuing a Tropical Cyclone Formation Alert earlier, the Joint Typhoon Warning Center issued its first warning on Tropical Depression 18W. On September 26 the Japan Meteorological Agency named this system Xangsane. The name Xangsane was submitted by Laos and means elephant. Later that day, the JMA upgraded Xangsane to a severe tropical storm. A bout of rapid intensification followed, and all three agencies, the JMA, JTWC and PAGASA all upgraded the storm to a typhoon late on September 26 or early September 27. Xangsane made landfall on Samar Island as a severe tropical storm.
The typhoon dropped heavy rainfall in the Philippines. To avoid the storm, transit authorities kept seacraft at several ports in the archipelago, leaving over 3,500 passengers stranded. Xangsane also prompted Philippine officials to close all schools, financial markets, and government offices in and around Manila. The typhoon killed over 200 people in the country, and produced strong winds and rainfall, downing power lines and causing mudflows. The strong winds caused moderate crop damage totaling to $7.2 million (2006 USD).
On the morning of October 1, Typhoon Xangsane made landfall in Danang. A weather station in the city recorded sustained winds of 137 km/h (85 mph), with gusts reaching 158 km/h (98 mph) and the atmospheric pressure measured was 963.3 hPa (28.45 inHg). The storm also caused heavy rainfall across a wide area from Nghệ An to Quảng Ngãi, with widespread rainfall amounts generally exceeding 200 mm (7.9 in). Some locations like Yên Thượng (Nghệ An), Minh Hoá (Quảng Bình) and Nam Đông (Huế) recorded rainfall over 500 mm (19.7 in). The storm has killed 72 people and left 4 others missing in Vietnam.
Severe Tropical Storm Bebinca (Neneng)
On October 1, a persistent area of low pressure just east of the Philippines developed into Tropical Depression 19W. The JMA had already been monitoring the storm. It was named Neneng by PAGASA, and later that evening was upgraded to a tropical storm by the Philippine authorities. The JMA and JTWC both designated the storm a tropical storm the next day, and it was named Bebinca by the JMA. Bebinca is a type of Macanese milk pudding.
The JTWC downgraded it to a tropical depression briefly between October 4 and 5 as wind shear took its toll. Its low-level circulation then became exposed with dry air entering the system, and both the JMA and JTWC declared the storm as a dissipating tropical depression on October 6. It soon became entrained within the circulation of a storm-force extratropical low, which swept across the Honshū coastal waters and led to 33 people dead or missing. It was upgraded to a severe tropical storm in post analysis.
Tropical Storm Rumbia
On October 3, a tropical depression south of Minami Torishima in high sea-surface temperatures gained enough convection and was designated Tropical Storm Rumbia by the JMA, although the JTWC had not even carried it as a tropical depression. Later that day, the JTWC issued a Tropical Cyclone Formation Alert, and began warnings on Tropical Depression 20W the next day. Rumbia slowly began to intensify while moving to the northwest, but on October 6 its low-level circulation became fully exposed, and the JTWC issued a final warning. The JMA followed suit soon after. The remnants of Rumbia later became extremely elongated on October 6, before being absorbed into the large extratropical low of Bebinca. The name "Rumbia" comes from a type of palm tree known as the sago palm.
Typhoon Soulik
On October 6, a tropical disturbance formed about 240 km (150 mi) north-northeast of Kwajalein with convection nearby, developing a low-pressure area two days later. On October 8, the JMA began monitoring the system as a tropical depression, upgrading it to Tropical Storm Soulik the next day, while the JTWC classified it as Tropical Depression 21W. An anticyclone to the north and a tropical upper tropospheric trough cell to the west provided outflow for the system. Soulik tracked northwestward around a ridge, slowly intensifying due to wind shear in the region. Around 1200 UTC on October 10, the JTWC upgraded Soulik to a typhoon, and the JMA followed suit late on October 12. Another ridge west of Soulik turned the storm northward, and the influence of both ridges caused Soulik to become nearly stationary about 100 km (62 mi) south-southwest of Iwo Jima. According to the JTWC, Soulik attained 1 minute winds of 165 km/h (105 mph) while the JMA reported 10 minute winds of 140 km/h (85 mph). At 0600 UTC on October 14, Soulik passed within 40 km (25 mi) of Iwo Jima. According to the JTWC, this would place the island within an area affected by typhoon-force winds. Later that day, an approaching trough increased the wind shear, causing the typhoon to weaken. By 1200 UTC on October 16, Soulik had transitioned into an extratropical cyclone as it rapidly traveled towards the northeast. The remnants were last noted south of the Aleutian Islands on October 17.
At 0600 UTC on October 9, a tropical storm watch was issued for Agrihan in the northern Mariana Islands, upgraded to a warning the next day. During the storm's passage, a total of 206 mm (8.1 in) of rain was recorded on Pagan Island. Sustained winds on the island reached 58 km/h (36 mph) and gusts reached 122 km/h (76 mph), although there was no damage in the region Waves up to 7.6 m (25 ft) affected the Bonin Islands. On Iwo Jima, winds were recorded up to 160 km/h (100 mph) with gusts up to 210 km/h (130 mph). Although Soulik spent over a day near Iwo Jima, no damage was reported as a result of the storm.
Tropical Depression Ompong
On October 12, a tropical disturbance that had been meandering in the Philippine Area of Responsibility was designated Tropical Depression Ompong by PAGASA. The depression slowly moved westward toward the Philippines, but wind shear from Typhoon Soulik prevented any intensification. The depression degenerated into an area of low pressure early the next day.
Typhoon Cimaron (Paeng)
An area of disturbed weather developed northwest of Chuuk on October 24. The disturbance moved west-northwestward over the next two days and gradually became better organized, and the Joint Typhoon Warning Center issued a Tropical Cyclone Formation Alert on the system on October 26. The system was designated Tropical Depression 22W by the JTWC later that day. The system continued to strengthen, and the JTWC upgraded it to a tropical storm on October 27. The Japan Meteorological Agency later followed suit and designated the system Tropical Storm Cimaron. The name Cimaron was submitted by the Philippines, and is a type of wild ox. The system quickly intensified, and was upgraded to a severe tropical storm by the JMA later that day. The system continued its quick intensification and was upgraded to a typhoon by both the JTWC and JMA on October 28. Further intensification occurred overnight, and the typhoon had rapidly deepened 65 hPa in 24 hours, from 985 hPa to 920 hPa, causing the JTWC to upgrade it to a 140-kn super typhoon at 9 a.m. UTC on October 29. It made landfall at about 12:30 p.m. UTC the same day on Northern Luzon. There, especially in Isabela Province, it lashed winds as much as 195 km/h and gusts as much as 230 km/h. Actually, all or parts of four provinces (Isabela, Quirino, Cagayan and Aurora) are declared under Signal No. 4 as the typhoon struck the island.
Cimaron then re-intensified after crossing the island, but not to its original strength, and was expected to curve towards Hainan, instead of moving towards Vietnam as previously forecast. On November 1, the JTWC upgraded the typhoon back into a Category 3-equivalent storm, and forecast that it would make a direct impact on Hong Kong. However, prediction models showed conflicting forecasts, and Cimaron remained quasi-stationary and weakened to a severe tropical storm on November 2. Dry air entrainment caused further weakening, with the JTWC dropping it to a minimal tropical storm at 3 p.m. UTC the next day. It weakened further, upwelling itself. The JTWC issued its final warning at 3 p.m. UTC on November 4. The JMA continued advisories on Cimaron until 12 a.m. UTC on November 6, when it was downgraded to a weak tropical depression.
The typhoon killed at least 19 people, many of whom drowned, and left 15 missing in the northern Philippines. It also killed a woman and her child after both are hit by a sheet of galvanized iron in Dilasag, Aurora Province, serving as the first human casualties. Further casualties happened as the typhoon passed through Luzon. Despite these, however, classes in Metro Manila were still not suspended. It also caused at least US$9 million in damage. 90% of the houses were damaged in a coastal town near where Cimaron made landfall. In the aftermath of the storm's passage across the Philippines, the Swedish International Development Cooperation Agency contributed 2.5 million Swedish krona (US$350,000) to aid efforts.
Typhoon Chebi (Queenie)
An area of disturbed weather developed east of the Mariana Islands on October 31, and moved west-northwestward over the next week without any increase in organization due to an unfavorable environment, until November 6, when it encountered more favorable conditions, and the Japan Meteorological Agency declared it a tropical depression on November 8. The Joint Typhoon Warning Center issued a Tropical Cyclone Formation Alert on the system later that day, and PAGASA named the system Tropical Depression Queenie shortly after. The JTWC classified it as Tropical Depression 23W early on November 9. According to the JTWC, lack of equatorial outflow prevented rapid intensification of the system. Later that day at 12 p.m. UTC, the JMA upgraded it to a tropical storm named it Chebi. The name Jebi, the correct spelling means swallow in Korean. The JTWC and PAGASA both followed suit later that day. Early on November 10, the JMA upgraded Chebi to a severe tropical storm as it continued to move west towards the Philippines, following a similar track as Typhoon Cimaron earlier in the season.
Just hours later, the JMA upgraded Chebi from severe tropical storm with 10-minute sustained winds of 55 knots to a typhoon with winds of 95 knots, with a pressure decrease of 40 hPa over three hours. The JTWC followed suit, upping Chebi from a tropical storm with 1-minute sustained winds of 55 knots to a Category 4-equivalent typhoon at 9 a.m. UTC. PAGASA raised Public Storm Warning Signal No. 4 for three provinces in Luzon, making Chebi the second storm (Typhoon Cimaron served as the first one that year.) in as many weeks to force a Signal #4. After rapidly deepening, Chebi weakened as it approached the Philippines. It made its first landfall near Casiguran, Aurora early on November 11, crossed Lingayen Gulf and its second landfall on Barangay Lucap, Alaminos about 8 hours later.
Encountering dry air entrainment and increased vertical wind shear in the South China Sea, Chebi began to gradually weaken to a severe tropical storm on November 12. It continued to weaken, turning northwards towards Hainan, and was downgraded to a tropical storm the next day. On November 14, the JMA issued its last advisory on the dissipating tropical depression. The JTWC issued its final warning later that same day as Chebi dissipated under the strong shear.
All told, the typhoon caused further casualties as well as damage caused by the earlier Typhoon Cimaron. After passing through Luzon, it left 1 dead and 10 injured. In Aurora Province, it caused floods, cutting the province's road system, as well as zero visibility, further isolating it from relief efforts.
Typhoon Durian (Reming)
An area of disturbed weather developed southeast of Chuuk on November 24. Wind shear near the disturbance soon decreased, allowing the depression to organize a little. It was designated a tropical depression by Japan Meteorological Agency on November 25, and later that day the Joint Typhoon Warning Center started issuing warnings on the system as it moved west-northwest towards Yap. The depression strengthened because it was in an area of high sea-surface temperatures, and there were distinct cloud features of anticyclonic outflow, according to the JMA. It was upgraded to a tropical storm on the afternoon of November 26 and named Durian. The name Durian refers to a fruit, "Durio zibethinus", and was submitted to the naming list by Thailand.
Moving west to west-northwestward, Durian intensified slowly. It became a severe tropical storm on November 27, and the next day it was named Reming by PAGASA when it entered the Philippine Area of Responsibility. Later on November 28, both the JMA and JTWC upgraded it to a typhoon as it continued to track towards the Philippines. A quick bout of intensification occurred on November 29, causing the JMA to upgrade the storm to 100 knots in wind intensity, and the JTWC to give it a Dvorak classification of 6.5 (127 kn) in a satellite fix. In 6 hours, Durian intensified from 90 kn 1-minute sustained winds to 125 kn winds. The JTWC then forecast a direct hit over Metro Manila later that day when it upgraded the storm to a super typhoon. PAGASA raised Public Storm Warning Signal 4, its highest warning level, over Catanduanes, Albay, Camarines Norte and Camarines Sur. It was the third time in 2006, and the third time in a row, that PAGASA raised Signal #4. Durian began to weaken slightly as it approached land, undergoing an eyewall replacement cycle, but quickly regained peak strength.
PAGASA claimed that the storm made landfall on the morning of November 30 over southern Catanduanes, although the JMA and JTWC did not recognize this landfall. Durian then made another landfall after crossing Lagonoy Gulf in northeastern Albay. After weakening due to interaction with land, Durian was downgraded back to a typhoon by the JTWC. The storm continued to move west, making landfalls on the Bondoc Peninsula in Quezon, on Marinduque and finally on Oriental Mindoro before exiting to the South China Sea.
Encountering dry air entrainment and vertical wind shear, Durian weakened slightly at first, but slowly began to reorganise and restrengthen as it neared Vietnam. Durian began to turn slightly southwest towards Nha Trang and Ho Chi Minh City on December 3. Eventually, Durian began to weaken again, and by December 4, the JMA downgraded it to a severe tropical storm. The storm maintained intensity as it skirted the Vietnamese coast moving southwest. After a brief second stint at typhoon strength, Durian finally made landfall in Bến Tre Province on December 5. The system rapidly weakened over land, and the JMA downgraded it to a tropical storm. The JMA and JTWC issued their final advisories later that day as Durian emerged into the Gulf of Thailand as a weak tropical depression. The remnants of Durian then crossed the coast of southern Thailand as it moved into the Bay of Bengal.
The storm killed at least 720 in the Philippines. The most damage occurred in Albay Province where the storm created mudslides of volcanic ash and boulders off Mayon Volcano. The Padang barangay of Legazpi City was severely affected with a large portion of the town covered in mud up to houses' roofs. At least 81 people have died and 16 people are missing in Vietnam from the storm.
Typhoon Utor (Seniang)
On December 2, an area of convection was spotted by the Joint Typhoon Warning Center southeast of Chuuk. Although convection decreased in the next few hours, on December 5 the JTWC once again noted flaring deep convection, and late on December 6 a Tropical Cyclone Formation Alert was issued. On the morning of December 7, both the JTWC and Japan Meteorological Agency-RSMC Tokyo reported that a tropical depression had formed. Soon after, the depression entered the area of responsibility of PAGASA, who named it Seniang. The depression strengthened throughout the day, and the JMA upgraded it to Tropical Storm Utor later that day. The name Utor was submitted by the United States on behalf of the Marshall Islands, and is a Marshallese word for squall line. Signal no. 3 has been raised in the provinces of Cebu, Leyte, Samar Provinces.
On December 8, the JMA upgraded Utor to a severe tropical storm. It intensified further and was upgraded to a typhoon by the JMA on the morning of December 9, with PAGASA and JTWC doing the same. The storm made landfall shortly after noon local time the same day. After crossing the Philippines, Utor took a track similar to Typhoon Chebi in November, first moving northwest then threatening to take aim at Hong Kong. It restrengthened to an 85-kn typhoon, before it slowed as it tracked in a weak steering environment within a weakness in the subtropical ridge. It then weakened as wind shear increased and dry air entrainment occurred. The JMA downgraded it to a severe tropical storm on December 13, and to a tropical storm the same day. The next day the JTWC downgraded the storm to a tropical storm and issued its last advisory.
The 2006 ASEAN and East Asia Summit, originally scheduled to start December 10, was put back a month due to the storm. Typhoon Utor killed at least 78 people and left 49 others missing in the Philippines. Damages from the typhoon were estimated at $1.9 million (2006 USD).
Typhoon Utor was blamed for heavy rains of up to 350 mm within 24 hours in southern Peninsular Malaysia, specifically Johor, Negeri Sembilan, Melaka and Pahang, causing massive floods within the southern region on December 18, 2006, which was considered as the worst in the Malaysian southern region history. However, there were also reports a few days earlier that adverse weather was not to be blamed on the typhoon. The worst-affected areas were Segamat and Kota Tinggi, where both towns were totally inaccessible by land after all main roads leading to those towns were all flooded. Until December 24, 2006, the floods had claimed 8 lives.
Tropical Storm Trami (Tomas)
On December 16, the Japan Meteorological Agency started issuing public bulletins on a tropical depression southwest of Guam. The Joint Typhoon Warning Center initiated warnings on Tropical Depression 26W the next day, despite having not issued a Tropical Cyclone Formation Alert. The system was upgraded to a tropical storm by the JMA and named Trami, which is a kind of rose tree. This name was submitted by Vietnam. The storm moved west-northwest rapidly towards the Philippines, but struggled against wind shear and an approaching cold front. Entering the PAGASA Area of Responsibility on December 18 as it maintained minimal tropical storm intensity, it was named Tomas. The JTWC issued its final warning later that day, having never upgraded the storm to tropical storm strength, citing no indication of a significant low-level circulation centre. On December 19, the JMA downgraded the storm to a tropical depression and issued its last public bulletin as the storm dissipated over water.
Other systems
On March 7, the JMA had upgraded a low-pressure area to a tropical depression formed by the remnants of 01W to the southeast of Mindanao, Philippines. During the next day, the system moved overland and made landfall over in Davao. The system emerged to the Sulu Sea, nearing Palawan until it weakened back into a low-pressure are on March 10. On March 11, the same system emerged to the South China Sea as the JMA had re-upgraded it back to a tropical depression. Although the system had experienced shear and became an exposed system, the depression fully dissipated late on March 12.
On July 3, both the China Meteorological Administration (CMA) and the JMA had identified a tropical depression about 200 km south of Sanya, Hainan. The depression moved northwest and made landfall a in Hainan on the same day. The depression made its second landfall over in the border of northern Vietnam and China as it rapidly deteriorated and absorbed by a front on July 4. Early on July 21, the CMA classified it as a tropical depression. The CMA issued its final warning on July 22 as it started to weaken rapidly. The system was absorbed by Typhoon Kaemi and fully dissipated on July 25. The JMA only classified the system as a low-pressure area throughout its lifetime. On July 28, a tropical depression had rapidly organized and persisted over in the Gulf of Tonkin and made landfall in the same location as the previous system at its peak strength with a pressure of 998 mbar. The system moved over land and fully dissipated on July 29. On September 13, two tropical depressions were monitored by the JMA. The first one persisted just south of Hong Kong and dissipated later on the same day. The second system formed from a stationary front near Taiwan and moved northwards. By September 15, the system dissipated while making landfall over in South Korea.
A trio of tropical depressions were also monitored by the JMA during late October. The first developed on October 21 about north of the Mariana Islands. The depression moved stationary until its circulation became exposed due to shear on October 23. The other two systems were also monitored very briefly by the JMA during October 22. One in the South China Sea as it moved westwards and fully dissipated six hours later, where its remnants made landfall in Vietnam during the next day; whilst the other persisted over in the Philippine Sea also bringing rainfall to Luzon during October 25, just before the arrival of Typhoon Cimaron.
Early on November 2, an extratropical cyclone formed about 2,350 km (1,460 mi) east of Tokyo, Japan. The system moved very slowly, gaining gale strength on November 3. After becoming a developed low and finishing an anticlockwise loop on November 4, the system started to move southeastwards and weaken slightly on the next day. However, late on November 6, the Japan Meteorological Agency (JMA) reported that the low began to intensify again, with the QuikSCAT data showing winds of 45 to 50 knots on the west side of the system. Consequently, the U.S. Naval Research Laboratory designated the system as 60W. The JMA reported that the cyclone started to develop again early on November 7, when convection had begun wrapping around the west side of the center. Late on the same day, following deep convection continued banding around the center, the cyclone, now about 650 km (400 mi) west of Midway Atoll, became a shallow symmetric warm-core system. Thus, SSD indicated that the cyclone had transitioned to a tropical storm. Early on November 8, plenty of dry air started to wrap around the cyclone as it began to drift southwestwards. Deep convection faded away more and more, resulting the system to weaken. Late on the same day, the cyclone was largely devoid of convection; therefore, JMA reported that the cyclone was below gale intensity. The SSD issued the final bulletin on the unclassified system. Although JMA still considered the system an extratropical cyclone, it only maintained a low-level circulation center without deep convection. On November 9, the cyclone passed through the Tropic of Cancer, entering the tropics. The system eventually dissipated early on November 11, about 370 km (230 mi) south of Wake Island. The cyclone was considered as an extratropical, subtropical, or tropical cyclone by different agencies and experts.
Storm names
Within the North-western Pacific Ocean, both the Japan Meteorological Agency (JMA) and the Philippine Atmospheric, Geophysical and Astronomical Services Administration assign names to tropical cyclones that develop in the Western Pacific, which can result in a tropical cyclone having two names. The Japan Meteorological Agency's RSMC Tokyo — Typhoon Center assigns international names to tropical cyclones on behalf of the World Meteorological Organization's Typhoon Committee, should they be judged to have 10-minute sustained windspeeds of 65 km/h (40 mph). While the Philippine Atmospheric, Geophysical and Astronomical Services Administration assigns names to tropical cyclones which move into or form as a tropical depression in their area of responsibility located between 135°E and 115°E and between 5°N-25°N even if the cyclone has had an international name assigned to it. The names of significant tropical cyclones are retired, by both PAGASA and the Typhoon Committee. Should the list of names for the Philippine region be exhausted then names will be taken from an auxiliary list of which the first ten are published each season. Unused names are marked in gray.
International names
During the season 23 tropical storms developed in the Western Pacific and each one was named by the JMA, when the system was judged to have 10-minute sustained windspeeds of 65 km/h (40 mph). The JMA selected the names from a list of 140 names, that had been developed by the 14 members nations and territories of the ESCAP/WMO Typhoon Committee. Following the season, Kaemi and Chebi had their spellings corrected to Gaemi and Jebi, as they were previously misspelled.
Philippines
During this season, PAGASA used its own naming scheme for the 20 tropical cyclones that either developed within or moved into their self-defined area of responsibility. This was the same list used from the 2002 season, except for the names Domeng, Ester, Glenda, Henry, Katring, Luis, Paeng, Queenie, Reming, Seniang, Tomas, Waldo, Chito, Felino, Harriet, and Indang, which replaced Dagul, Espada, Gloria, Hambalos, Kaka, Lagalag, Paloma, Quadro, Rapido, Sibasib, Tagbanwa, Wisik, Ciriaco, Forte, Hunyango, and Itoy, respectively.
Storms were named Domeng, Ester, Glenda, Henry, Luis, Ompong, Paeng, Queenie, and Tomas for the first time; the names Katring, Neneng, Reming, and Seniang were carried on from previous lists. An unused name in the auxiliary list, Indang, was also brought from the old lists; it was last used in 1993.
Although the name Gloria was not retired in 2002, it was replaced with the name Glenda, as the former was the name of the incumbent Philippine president at that time.
Retirement
Following the season, the ESCAP/WMO Typhoon Committee would retire Chanchu, Bilis, Saomai, Xangsane, and Durian from the naming lists. They would be replaced by Sanba, Maliksi, Son-Tinh, Leepi, and Mangkhut for future seasons.
PAGASA announced that Milenyo and Reming would be retired from their naming lists, and were replaced with Mario and Ruby for future seasons.
Season effects
This table summarizes all the systems that developed within or moved into the North Pacific Ocean, to the west of the International Date Line during 2006. The tables also provide an overview of a systems intensity, duration, land areas affected and any deaths or damages associated with the system.