


Explore on Lably
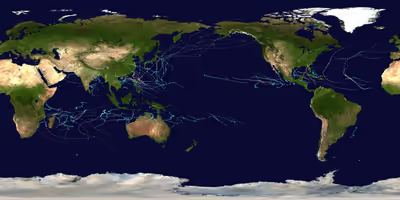
ToursExplore Lably’s 3D tours2024 had an average amount of storms forming, yet featured a lot of destructive activity. For instance, the West Pacific had an average year of 27 named storms, yet became the fourth most destructive season in the basin's history. Similarly, the North Atlantic had a very costly and active season with 18 storms being named. The East Pacific had a below average year with only 14 storms forming, yet also featured Hurricane John, which would go on to become the fourth costliest hurricane in the basin's history. The North Indian Ocean also recorded below average activity, with only 4 storms being named. The Southern Hemisphere had near-average activity, of which the strongest cyclone, the aforementioned Cyclone Chido, would become the costliest cyclone ever recorded in the South West Indian Ocean basin. The number of Category 5 tropical cyclones that formed this year totalled to six, while 23 major tropical cyclones formed throughout the year, which was slightly below average. The accumulated cyclone energy (ACE) index for 2024 (seven basins combined), as calculated by Colorado State University (CSU) was 621.2 units overall, which was below the 1991-2020 mean of 789.0 units globally.
Tropical cyclones are primarily monitored by 10 warning centers around the world, which are designated as a Regional Specialized Meteorological Center (RSMC) or a Tropical Cyclone Warning Center (TCWC) by the World Meteorological Organization (WMO). These centers are: National Hurricane Center (NHC), Central Pacific Hurricane Center (CPHC), Japan Meteorological Agency (JMA), Indian Meteorological Department (IMD), Météo-France (MFR), Indonesia's Meteorology, Climatology, and Geophysical Agency (BMKG), Australian Bureau of Meteorology (BoM), Papua New Guinea's National Weather Service (PNGNWS), Fiji Meteorological Service (FMS), and New Zealand's MetService. Unofficial, but still notable warning centers include the Philippine Atmospheric, Geophysical and Astronomical Services Administration (PAGASA; albeit official within the Philippines), the United States Navy's Joint Typhoon Warning Center (JTWC) and the Brazilian Navy Hydrographic Center.
Global atmospheric and hydrological conditions
After the New Year, the Madden–Julian oscillation's (MJO) amplitude weakened, with its eastward propagation slowing down due to the positive phase of the Indian Ocean Dipole (IOD) and an equatorial Rossby wave. Despite that, the MJO briefly caused El Niño-like wind anomalies to become easterly at the Date Line. There was also a significant increase in convection across the eastern Indian Ocean in January as the Dipole began weakening. However, in the middle of January, the MJO began steadily intensifying, enhancing convection across the Maritime Continent. Despite that, intra-seasonal activity persevered, although the MJO produced convection in the Western Pacific. In Australia, the monsoonal trough's arrival was delayed until January 10, possibly due to the El Niño event. On April 16, the dominant El Niño event ended.
Despite the unseasonably warm temperatures in the North Atlantic, the equatorial Atlantic cooled rapidly into an "Atlantic Niña" due to upwelling caused by shifts in the trade winds and the Atlantic zonal mode. The effects of an Atlantic Niña is not certain but it is contrary to the assumptions that the NOAA used in their forecast of seasonal activity. CSU associated the quietness of the Atlantic during the month of August and the period after Ernesto dissipated–despite predictions of an extremely active peak period–to tropical waves forming too far north, warm upper-level winds causing destabilization, wind shear in the East Atlantic, and factors associated with the MJO.
Sign in to keep reading
3 more chapters are free with a Lably account.
Summary
North Atlantic Ocean
Though the 2024 Atlantic hurricane season officially began on June 1, it got off to the second slowest start, only to be succeeded in 2025, which then became the slowest start to the Atlantic hurricane season, since 2014. This was due to a large stationary heat dome over Central America and Mexico, as tropical cyclogenesis in June often occurs over the Gulf of Mexico and northern Caribbean Sea. The season's first named storm, Tropical Storm Alberto, formed in the western Gulf of Mexico on June 19, then proceeded to make landfall on the northeastern coast of Mexico the following day. On June 28, Tropical Storm Beryl formed at 43.6° W, being the second-easternmost cyclone on record in the tropical Atlantic, behind only Tropical Storm Bret in 2023. The next day, Beryl intensified into a hurricane at 49.3° W, becoming the easternmost June hurricane in the tropical Atlantic on record, ahead of the 1933 Trinidad hurricane. Reaching 53.9 °W, Beryl became the easternmost June major hurricane in the tropical Atlantic, and the first June major hurricane since Alma in 1966. Beryl also became the earliest Category 4 Atlantic hurricane on record, ahead of 2005's Hurricane Dennis. On June 30, Tropical Depression Three formed in the Bay of Campeche, becoming Tropical Storm Chris only six hours later. Chris quickly moved ashore in Mexico the following morning. Hurricane Beryl became a Category 5 that same morning, becoming the earliest Category 5 hurricane on record in the Atlantic, and beating out Hurricane Emily of 2005. After Beryl dissipated on July 11, the Atlantic basin would fall under a period of inactivity due to the Saharan air layer, which suppresses tropical activity, persisting over the open Atlantic alongside dry air typically occurring during this period of the season.
Activity resumed at the start of August, with Hurricane Debby developing in the Gulf of Mexico on August 3, before making landfall in Florida as a Category 1 hurricane two days later. It then slowed down over land afterwards and dropped heavy rain and caused widespread flooding in the Southeastern United States. A week after, Hurricane Ernesto moved through the Caribbean, and strengthened to a Category 2 hurricane, before eventually weakening and making landfall on Bermuda as a Category 1. This made Ernesto the first hurricane to make landfall on the island since Hurricane Paulette in 2020. Ernesto continued to move northward, passing by Newfoundland as it turned post-tropical.
After nearly three weeks of inactivity, the longest in over fifty years at that point in the season, Hurricane Francine formed on September 9. Tropical Storm Gordon followed suit two days later on September 11, with Francine making landfall in Louisiana as a Category 2 system later that day. Four systems developed during the final week of September, starting with Hurricane Helene on September 24. The system affected the Yucatán Peninsula on September 25, before making landfall in the Big Bend region of Florida late on September 26 as a Category 4 hurricane, where it rapidly weakened into a tropical depression by noon of September 27. Hurricane Isaac formed on September 26 and later peaked as a Category 2 hurricane. On September 27, Tropical Storm Joyce formed just west of the Cabo Verde Islands. September's activity ended with the formation of Hurricane Kirk on September 29, which reached its peak intensity on October 4.
Early October saw the formations of Hurricanes Leslie and Milton, which along with Kirk, marked the first time on record that there were three hurricanes simultaneously present in the Atlantic basin after September. Milton notably underwent explosive rapid intensification within the Gulf of Mexico to become the second Category 5 hurricane of the season, making 2024 the first Atlantic hurricane season since 2019 to feature multiple Category 5 hurricanes. It became the first Atlantic hurricane since Hurricane Wilma to reach a pressure below 900 mb (26.58 inHg) and the most intense tropical cyclone ever recorded over the Gulf of Mexico, tied with Hurricane Rita. Later in the month, two tropical cyclones formed on October 19. Tropical Storm Nadine formed early in the day near the coast of Belize, where it made landfall a few hours later, while Hurricane Oscar formed near Turks and Caicos, becoming the smallest hurricane on record in the Atlantic basin. On November 2, Tropical Storm Patty developed from a non-tropical gale low just northeast of the Azores. Then, two days later, Tropical Storm Rafael formed in Southwestern Caribbean. It became a Category 3 hurricane just prior to making landfall in Cuba. It made a secondary stronger peak of a 120 mph Category 3, on November 8, before weakening.
Eastern & Central Pacific Oceans
On June 29, the National Hurricane Center (NHC) noted that a low-pressure area could form off the coast of Mexico. On July 2, a broad area of low pressure formed south of the coast of Mexico. Showers and thunderstorms within the disturbance became better-organized beginning late the following day, and Tropical Depression 01E formed during the morning of July 4. Slightly intensifying, the compact system became Tropical Storm Aletta a few hours later. Three weeks later, Tropical Storm Bud formed off the southern tip of Baja California. A week later on July 31, Tropical Storm Carlotta formed out of a low-pressure area. Three storms formed quickly during the first week of August: Daniel, Emilia, and Fabio. After a brief lull in activity, Hurricane Gilma formed, undergoing a few rounds of intensification, one of which, being a Category 4 peak, making Gilma the first major hurricane of the Eastern Pacific season. Hurricane Hone formed soon after, becoming the Central Pacific's first named storm in the basin since 2019. They were joined by Tropical Storm Hector on August 25 in the eastern Pacific proper. Hone would later move out of the basin into the Western Pacific.
A two-week break in activity came to an end when Tropical Storm Ileana formed on September 12. The storm grazed northwestern Mexico twice before dissipating. Hurricane John developed over a week later and rapidly intensified into the second major hurricane of the season prior to making landfall in southern Mexico. In late October, Hurricane Kristy formed off the coast of southern Mexico, in-part from the remnants of Atlantic basin Tropical Storm Nadine, and intensified to Category 5 strength out in the open ocean. A few days later, Tropical Storm Lane formed on November 2.
Western Pacific Ocean
The Pacific typhoon season began abnormally late, with no systems forming for five months until May 22, when a tropical storm named Ewiniar formed southeast of Palau, marking it as the fifth-latest start of a Pacific typhoon season since reliable records began. Ewiniar went straight to the Philippines to make nine landfalls in Homonhon Island; Giporlos, Eastern Samar; Basiao Island; Cagduyong Island; Batuan, Masbate; Masbate City; Torrijos, Marinduque; Lucena, Quezon and Patnanungan. It began to move over the warm tropical waters of Lamon Bay, where the JTWC and the JMA upgraded Ewiniar into a minimal typhoon. Ewiniar began to deteriorate as it moved away from land due to its topographical effects from the island. On May 30, another tropical depression formed southeast of Haikou, China. The next day, at 03:00 UTC, JTWC designated the disturbance as Tropical Depression 02W. A few hours later, JMA assigned the name Maliksi as they upgraded 02W into a tropical storm. Shortly after being named, on May 31, Maliksi made landfall in Southern China. JMA and JTWC discontinued warnings as Maliksi moved inland and dissipated on June 2.
After many weeks of inactivity, on July 13, a tropical depression formed east of Vietnam. Shortly after, it tracked into Vietnam, dissipating soon after. On July 19, two tropical disturbances were recognized by the JTWC: one southeast of Manila while the second is east of Palau. Soon after, the two disturbances on either side were upgraded into a depression and named by the PAGASA. The first west of Batangas was named Butchoy while the second east of Virac was named Carina. JTWC followed suit and designated Butchoy as Tropical Depression 04W and Carina as Tropical Depression 05W. At 16:05 JST (00:05 UTC) of the next day, 05W was given the name Gaemi by the JMA. On July 21, Butchoy also intensified into a tropical storm, assigning the name Prapiroon from the JMA. Prapiroon moved through the South China Sea as a mild tropical storm before landfall over Wanning, Hainan. Prapiroon moved through the Gulf of Tonkin, where it further intensified into a severe tropical storm. Early on July 23, Prapiroon made its second and final landfall in Quảng Ninh, Vietnam. Rapid weakening ensued as Prapiroon moved inland.
Being in a favorable environment in the Philippine Sea, Gaemi continued to strengthen into a severe tropical storm as it moved northeastward slowly. Early the next day, JMA upgraded Gaemi into a typhoon, the second to occur in this season. JTWC also followed suit and upgraded Gaemi into a Category-1 typhoon. Owing to its warm sea surface temperature and low vertical wind shear, on July 24, Gaemi rapidly intensified into a Category-4 typhoon, with 10-minute sustained winds of 155 km/h (100 mph), equivalent to a very strong typhoon category by the JMA. Gaemi stalled and executed a counterclockwise loop near the coast and slightly weakened into a Category-3 typhoon. Overnight, Gaemi made landfall over Hualien, Taiwan at that intensity. The mountain ranges of the country made the structure of the storm torn apart, causing Gaemi to further weaken into a Category-2 typhoon. The country's mountain ranges tore apart the structure of the storm, causing Gaemi to weaken further into a Category-2 typhoon. The next day, Gaemi made its final landfall at Xiuyu, Putian at Fujian Province as a weakening tropical storm. Moving inland, the storm rapidly weakened until it dissipated on July 27.
On August 5, a low-pressure area was formed in the Bonin Islands. The disturbance was in an environment with low to moderate wind shear and warm SSTs. JTWC later classified the disturbance into a depression the next day, giving the designation 06W. Early on August 8, JMA upgraded the depression into a storm, naming it Maria. The storm further strengthened into a severe tropical storm on the same day, and eventually made landfall in Ofunato. Shortly after, Typhoon Ampil and Tropical Storms Son-Tinh and Wukong formed; Ampil became a very strong typhoon, brushing the city of Tokyo and eastern Japan. Tropical Storm Jongdari was also named, as well as Shanshan, which made landfall near Tokyo. On August 30, a tropical disturbance formed near Palau. On the same day, JMA started to issue advisories for the system as a depression. As it entered the Philippine Area of Responsibility (PAR), the agency gave it the name Enteng on the first day of September. At 21:00 JST (13:00 UTC), JMA developed into a tropical storm, naming the system as Yagi. The storm made its first landfall in Casiguran in the province of Aurora. The mountainous terrain of the Cordillera Central had made Yagi weakened as it moved inland. It left PAR on early September 4 as it continues to intensify in the South China Sea.
Yagi later strengthened into a typhoon due to its highly favorable environmental conditions. The following day, it rapidly intensified, developing a distinct eye and briefly reaching Category 5-equivalent super typhoon status as it approached Hainan. The whole cloud system of Yagi covered the entire South China Sea. Although Yagi slightly weakened, it made its second landfall over Wenchang City in Hainan. The storm then moved over Haikou, China, and continued to make another landfall in Xuwen County, Guangdong. Afterward, Yagi entered the open waters of the Gulf of Tonkin.
Yagi became one of only four Category-5 typhoons recorded in the South China Sea, alongside Pamela (1954), Rammasun (2014), and Rai (2021). It also marked the most powerful typhoon to strike Hainan in autumn since Typhoon Rammasun in 2014. On September 7, Yagi underwent a period of reorganization and regained Category 4 status before making a historic landfall between Haiphong and Quang Ninh in Vietnam. Upon landfall, Yagi became the strongest storm to impact Northern Vietnam. The typhoon then weakened rapidly into a remnant low as it moved inland, dissipating on September 8. Even after dissipation, it still wreaked havoc, bringing heavy floods to Myanmar, Laos, and Thailand.
While Yagi was on its way to making landfall in the Philippines, JTWC announced another formation of a tropical disturbance in the open Pacific Ocean on September 2. JMA also started issuing advisories, and it was recognized as a tropical depression in the same location. Two days later, as JTWC upgraded it into a depression, it received its designation as 13W. A day later, JMA reported that 13W developed into a tropical storm, giving the name Leepi as the twelfth named storm of this season. Leepi then accelerated northeastwards before it became an extratropical cyclone on September 6.
On September 9, a tropical depression formed over the Micronesian Islands. The following day, the JTWC designated it as 14W. As it moved over Guam, 14W intensified into a tropical storm and was named Bebinca by the JMA. Despite encountering dry air, Bebinca strengthened as it began its northwestward movement. At 18:00 PHT on September 13, Bebinca entered the Philippine Area of Responsibility and was named Ferdie by PAGASA. Bebinca later strengthened into a minimal typhoon on the next day. On September 16, Bebinca landed in Shanghai, China as a weakening Category-1 typhoon, and became the strongest typhoon to hit Shanghai since Typhoon Gloria of 1949.
As Bebinca moved toward eastern China, two tropical depressions formed in the Pacific on September 15—one near Guam and another within the Philippine Area of Responsibility (PAR). The JTWC designated the depression near Guam as 15W. It soon intensified into a tropical storm and was named Pulasan by the JMA. The PAR tropical depression was given the name Gener by PAGASA. At 02:00 PHT the following day, Gener landed over Palanan, Isabela. The storm continued to move westward over Northern Luzon, maintaining its strength as a depression. Meanwhile, Pulasan briefly entered the PAR at 18:30 PHT (10:30 UTC) and was assigned the name Helen. Gener was upgraded by the JTWC into a tropical depression, getting the designation 16W. On September 19, 16W was upgraded to a tropical storm and named Soulik by the JMA. Soulik made landfall over Vĩnh Linh District, Quảng Trị, in Vietnam. Meanwhile, Pulasan also made landfall over Zhoushan, China, similar to where Bebinca had made landfall three days earlier. After that, it made a second landfall over Shanghai, marking the first time since reliable meteorological records exist that two typhoons make landfall over Shanghai with only two days in between.
On September 20, a low-pressure area formed over Northern Luzon. The JTWC later designated the disturbance as Invest 90W upon its formation. Being inside the PAR, PAGASA initiated advisories and named the system Igme. The JTWC soon upgraded it into a tropical depression, designating it as 17W. Igme later curved southwestwards, passing closely to Taiwan. The storm later dissipated on September 22 after topographical interaction and high vertical wind shear had weakened the system significantly.
Following, on September 24, a tropical depression formed in the Pacific south of Japan. That day, JTWC designated the system as 18W. The following day, the JMA upgraded the depression into a tropical storm, earning the name Cimaron. The storm moved southwestwards, maintaining its intensity. As it moved westwards, Cimaron weakened into a tropical depression as an unfavorable environment hindered any intensification. Cimaron later dissipated on September 27. Shortly later the same day, another low-pressure area formed near the Northern Mariana Islands. Despite being in a marginal environment, the disturbance managed to be organized and designated as 19W by the JTWC. On September 27, the JMA upgraded 19W into a tropical storm, naming it Jebi.
Shortly after Cimaron weakened into a depression, an area of low pressure formed in the Philippine Sea near extreme Northern Luzon on September 26, PAGASA shortly issued bulletins regarding the disturbance and was named Julian as it developed into a depression. The following day, the JTWC designated Julian as 20W, upgrading it into a tropical depression. On September 28, the JMA upgraded 20W into a tropical storm, naming it Krathon, a replacement name for Mangkhut. It then intensified into a Category-1 typhoon, heading towards Sabtang, Batanes. Shortly after, the typhoon began its rapid intensification and in two days, the system reached its peak intensity equivalent to a Category-4 super typhoon. On October 3, Krathon made landfall over Siaogang District in Kaohsiung, Taiwan. The typhoon became the first storm to make landfall in Taiwan's densely populated western plains since Typhoon Wayne in 1986. The storm weakened through inland, marking the first time it had happened in Taiwan since Tropical Storm Trami in 2001. The JMA continued to track the system to the South China Sea before it dissipated on October 4.
On October 5, a tropical depression formed near Guam. The following day, the JTWC designated it as 21W. Despite moving through warm waters, high wind shear hindered any further development, causing it to weaken back into a depression. On October 8, the JTWC issued its final warning, with dissipation expected in the next 12 hours. The next day, 21W intensified into a tropical storm, receiving the name Barijat from the JMA. Later in the day, JTWC reissued advisories on Barijat and strengthened into a tropical storm. However, both agencies later made their final warning for the last time as the storm dissipated on October 11.
On October 19, a tropical depression formed nearby Yap. The next day, it was assigned as 22W by the JTWC, acknowledged as a tropical depression. Then, it moved into the PAR and was named Kristine by PAGASA. Soon after, the JMA upgraded it to tropical storm status and was given the name Trami. Many parts of the Philippines were issued wind storm signals prior to its approach to the country. On October 23, Trami later strengthen into a severe tropical storm, causing some areas in northern and central Luzon to upgrade to Tropical Cyclone Wind Signal No. 3. At 04:30 UTC of the next day, Trami made landfall over the province of Divilacan, Isabela. The following day, Trami emerged above the coastal waters of southern Ilocos Sur, leaving the remnants of a circulation center over Northern Luzon. This caused a lot of areas in the country to bring torrential rains with gusty winds throughout the day.
As Trami crossed through the Cordilleras, another tropical disturbance was formed southeast of Guam on October 24. JMA began to track the system thereafter as a tropical depression, with a gale warning also being issued. The next day, JMA upgraded the disturbance into a tropical storm, assigning the name Kong-rey. Since another disturbance was formed as Invest 99W on the northern side, the JTWC canceled warnings on the southern side, designated as 98W and issued Kong-rey at 99W, located in the north side. Kong-rey was later designated as Tropical Depression 23W by the JTWC. The storm entered PAR, receiving the local name Leon. On October 29, Kong-rey started undergoing rapid intensification and became a Category-4 super typhoon the following day. With that, Kong-rey achieved a peak intensify of 1-minute sustained winds of 240 km/h (150 mph) and a central pressure of 925 hPa (27.32 inHg).
Shortly after reaching its peak intensity, Kong-rey started to slightly weaken as it went through eyewall replacement cycle moving northwestwards. The storm later made a historic landfall over Chenggong, Taitung in Taiwan, marking the first major typhoon to make landfall in the country after mid-October, and the largest typhoon to hit since Typhoon Herb of 1996. Kong-rey later reemerged through the Taiwan Strait with a weakened convective structure around the center. Kong-rey weakened and transitioned to an extratropical cyclone over Sasebo, Japan, causing both agencies to cease advisories on November 1.
Just after Kong-rey transitioned to a post-tropical cyclone, an area of low pressure was formed near Palau on November 1. However, JTWC discontinued issuing advisories as unfavorable conditions hindered the development. Two days later, JTWC reissued advisories as signs of organization of the disturbance continued to form. At 14:00 UTC, the JTWC along with JMA upgraded the system to a tropical depression, assigning it the designation Tropical Depression 24W. Later at 18:00 UTC of November 3, 24W intensified into a tropical storm, gaining the name Yinxing by the JMA. Yinxing would enter the Philippine Area of Responsibility, receiving the name Marce by PAGASA. The storm would continue to intensify over the Philippine Sea until the agencies prompted to classify into a typhoon on the following day. It then reached its peak intensity of a Category-4 typhoon, with 1-minute sustained winds of 230 km/h (145 mph) and a central pressure of 940 hPa (27.76 inHg). Around 3:40 PM PHT (07:40 UTC) of November 7, Yinxing made landfall over Santa Ana, Cagayan. After crossing through Babuyan Channel, the storm made its second landfall over Sanchez Mira, Cagayan. Afterwards, Toraji (Nika) formed which was followed by Man-yi (Pepito) and Usagi (Ofel), the next day.
North Indian Ocean
After months of inactivity, on 21 May, a low-pressure area (LPA) started to develop due to an upper-air circulation over the Bay of Bengal. The LPA got strengthened by favorable conditions such as Rossby waves, Madden–Julian oscillation and the beginning of the Monsoonal flow in the Indian Ocean. Hence, IMD (India Meteorological Department) began monitoring the cyclonic circulation. Later that day, Joint Typhoon Warning Center (JTWC) also began tracking the system, noting that the system could become a monsoon depression. On 23 May, the IMD upgraded the system to a well-marked low, stating that it was rapidly coalescing. The system then intensified into a depression (BOB 01/Invest 99B) on 24 May. Owing to favorable conditions and high Sea surface temperature over Northern Bay of Bengal, the depression intensified into a cyclone named Remal. On May 26, Remal intensified into a severe cyclonic storm before making landfall at Bangladesh. Remal later moved inland and dissipated on May 28.
On July 19, IMD marked an area of low pressure off the coast of Odisha. The disturbance was later upgraded into a depression, designated as BOB 02. However, the depression moved inland, weakening into a well-marked low-pressure area before dissipating the next day. On August 4, a low-pressure area developed over Gangetic West Bengal, and adjoining Jharkhand. Hours later, the land depression intensified into a depression.
On November 23, a low pressure area formed over east equatorial Indian Ocean and south-east Bay of Bengal. It moved westward (Towards Tamil Nadu - Sri Lanka coasts) and intensified into a depression on November 25. On November 29, the depression intensified into cyclone Fengal.
South-West Indian Ocean
January - June
The first system of the season, Tropical Storm Alvaro, formed on December 30, 2023, and persisted into 2024. Before becoming post-tropical on January 3, it made landfall in Morombe District, Madagascar, killing nineteen people. After a brief lull in activity, Tropical Cyclone Belal formed on January 11. severely affecting Mauritius and Réunion, with the latter suffering the brunt of the storm, causing six deaths in the process. On January 22, Moderate Tropical Storm Candice formed. Eight days later, Intense Tropical Cyclone Anggrek entered the basin, while Tropical Depression 05 formed. Intense Tropical Cyclone Djoungou formed on 13 February and exited the basin less than a week later. Severe Tropical Storm Eleanor formed on 17 February, bringing intense rainfall and winds causing massive damage. Severe Tropical Storm Filipo emerged on 2 March near Mozambique displacing 48,000 people and damaging 8,000 houses. Tropical Depression Neville crossed into the basin on 24 March but MFR discontinued warning issuance. Short-lived Tropical Cyclone Gamane emerged on 25 March, causing a total of 19 deaths, 3 people missing and at least 90,000 affected.
Off-season Tropical Cyclone Hidaya made rare landfall in Tanzania on 30 April. Another off-season, Tropical Cyclone Ialy, formed on 16 May near Comoros, killing a girl and injuring four others, while another person died due to a fallen wall.
July - December
The season started on 15 August, unusually early for the basin, with a low-pressure system forming near the equator. Despite unfavourable conditions, it briefly intensified into a tropical depression before weakening and dissipating. In early late September MFR started tracking an area of low pressure in the far north-eastern part of the basin, it was named Ancha late on 1 October, making it the first off-season named storm since Ialy during the previous season. After a typical period of inactivity in October and November, a low-pressure system, Bheki, formed on 14 November. It peaked as an Intense Tropical Cyclone on 18 November, becoming the strongest November tropical cyclone on record in the basin based on sustained wind speeds. It was also the third-strongest November tropical cyclone in the basin based on minimum central pressure. It weakened as it moved towards the Mascarenes, but lead to flooding and some damage in Mauritius. On 9 December, Chido formed. Chido began steadily intensifying and on 10 December, it intensified to a severe tropical storm and later that day it intensified to a Cyclone. It reached its peak on 11 December as a Very Intense Tropical Cyclone before weakening to an Intense Tropical Cyclone. On 13 December, Chido's outer and inner rain bands affected Madagascar before making landfall the island of Mayotte. On 14 December it made landfall on northern Mozambique. Chido dissipated on 16 December.
Australian Region
January - June
The season started early on 1 December where Cyclone Jasper crossed into the basin as a tropical low from the South Pacific and made landfall in Far North Queensland as a Category 2 tropical cyclone on 13 December.
After a significant lull in activity, Tropical Cyclone Anggrek and Tropical Low 03U formed on 10 and 11 January respectively, with the latter dissipating on 23 January. The next day, Cyclone Kirrily formed. Tropical Low 06U formed on 30 January, dancing out of basin the next day and waltzing back in on 5 February. Tropical Cyclone Lincoln formed on 16 February and made landfall on the Gulf of Carpentaria coast. Severe Tropical Cyclone Neville formed north of the Cocos Islands on 1 March and left the basin 20 days later. Severe Tropical Cyclone Megan formed on 13 March from a tropical low over the coast of the Gulf of Carpentaria. Short-lived Tropical Low 10U formed and weakened within the same day of 14 March. Severe Tropical Cyclone Olga formed within a monsoon trough south of Sumba on 4 April. Tropical Cyclone Paul formed 5 days later over the Louisiade Archipelago. Tropical Low 12U formed on 12 April and remained traceable.
Off-season Tropical Low 16U formed on 4 May and ended the season.
July - December
The season officially started on 1 November 2024. On 14 November, the Bureau of Meteorology (BoM) noted that a tropical low may form west of Sumatra. A westerly wind shear enhanced the disturbance's development. Despite moderate to high wind shear displacing deep convection, the tropical low further developed and the Joint Typhoon Warning Center (JTWC) issued a tropical cyclone formation alert. On 28 November, the BoM named Tropical Cyclone Robyn. The storm officially peaked as a high-end tropical storm before increasing wind shear caused the storm to dissipate. On 4 December, Tropical Low 04U formed off the coast of Java and headed west before dissipating on 11 December. Unfortunately, the disturbance caused landslides and floods, killing eleven people and leaving seven missing. The rest of December had Tropical Lows 02U, 06U, 07U, and 08U. Tropical Low 07U formed southeast of the Cocos Islands and JTWC designated it as a tropical storm. 08U later became Category 3 Cyclone Dikeledi in the Southwest Indian Ocean.
South Pacific Ocean
January - June
After a significant lull in activity, Tropical Disturbance 04F formed on January 25 and dissipated the next day. On February 1, 06U entered the South Pacific basin and was designated 05F by the FMS. After the system exited to the Australian region and struggled against moderate wind shear, 05F re-entered on February 7 and JTWC designated it tropical storm 12P. On February 3, the FMS designated 06F and was later named Nat on February 5. The FMS upgraded Nat to a Category 2 tropical cyclone the next day before wind shear led to the system's demise. Simultaneously, Tropical Disturbance 07F formed on February 5 before dissipating. 08F quickly developed and the FMS named Osai on February 7 before an increase in wind shear caused the storm to dissipate. On February 11, 09F developed and was short-lived due to high wind shear. On February 14, the FMS designated 10F and soon the JTWC initiated advisories on Tropical Cyclone 15P. However, 10F was short-lived due to increasing wind shear.
July - December
The season began abnormally late, the first system of the season, Tropical Depression 01F formed in late December. The storm eventually made landfall in Fiji and dissipated during the last few days of the year. Tropical Disturbances 02F and was designated on 31 December and stayed out to sea moving southeastwards before dissipating 3 days later.
South Atlantic Ocean
On February 16, the CHM stated that a subtropical depression had formed in the Rio de Janeiro basin. Two days later, the cyclone acquired tropical characteristics and became a tropical depression. In the early hours of 19 February, the depression developed into a tropical storm, thus receiving the name Akará.
In the early hours of December 15, 2024, Subtropical Storm Biguá formed off the coast of the Brazilian state of Rio Grande do Sul, according to CHM.
Mediterranean Sea
On January 31, according to a report by Kacper Płonowski, a storm named Avgi by the Hellenic National Meteorological Service had transitioned into a subtropical storm near the northwestern coast of Cyprus. Avgi tracked towards the southeast before it made landfall on the Israeli coastal plain as a subtropical depression on February 2, dissipating afterwards.
On September 23, a brief subtropical depression occurred in the Black Sea, dissipating the following day. The system brought flooding rains to northern Turkey.
Systems
January
January was slightly active featuring eight systems forming with four of them being named. Tropical Storm Alvaro from the South-West Indian Ocean persisted into 2024 and made landfall in Madagascar, killing nineteen and causing some damages. Cyclone Belal affected Reunion and Mauritius, causing six fatalities. In the Australian region, Cyclone Kirrily affected Queensland while Cyclone Anggrek formed in the basin, entered the South-West Indian Ocean on January 25, and became a Category 4-equivalent tropical cyclone on January 28, making it the strongest storm of the month, as well as the first major tropical cyclone of the year.
February
February was slightly above-average, featuring nine systems with six of them being named. In the South Pacific, Cyclones Nat and Osai affected Samoa, with the former peaking as a Category 2 tropical cyclone before dissipating on February 10. In the South-West Indian Ocean, Cyclone Djoungou is the strongest system this month. Cyclone Eleanor affected sparsely over the Mascarene Islands. In the South Atlantic, Tropical Storm Akará affected Southern Brazil. In the Australian region, Cyclone Lincoln crossed through the Northern Territory inland just after making landfall in that particular area.
March
March was near-average, featuring seven systems, with four of which have been named. The month began in the South-West Indian Ocean with Tropical Storm Filipo, which affected Madagascar and Mozambique as a severe tropical storm. On the other side of the basin, Cyclone Megan made landfall in Borroloola, Australia just after reaching its peak as a Category-3 cyclone, bringing destructive winds and heavy rain in the area. Cyclone Neville, is the strongest tropical cyclone in this month. Before the end of the month, Cyclone Gamane made landfall in the northeastern tip of Madagascar as a Category-2 cyclone before it dissipated on March 28.
April
April was an unusually inactive month, featuring four systems, with three getting named. The month started with Cyclone Olga, which formed over the open waters of Western Australia and peaked as a Category 4-equivalent major cyclone as it remains over the Indian Ocean. Shortly after Olga degenerated into a tropical low, short-lived Cyclone Paul would also form in the Coral Sea. 12U formed on April 12 and dissipated 2 days later. On the last day of April, Cyclone Hidaya formed near Seychelles and made a rare landfall in Tanzania as a weakening tropical storm.
May
May was an average month, featuring five cyclones, with four receiving names, the month started with Cyclone Ialy, which formed near Comoros and intensified into a compact tropical cyclone. On May 22, Typhoon Ewiniar formed southeast of Palau, traversing the Philippines before strengthening as a potent Category-2 typhoon over Lamon Bay. Cyclone Remal formed in the Bay of Bengal on May 24. In the latter part of May, Tropical Storm Maliksi formed in the South China Sea and made landfall in Guangdong Province as a weak tropical storm.
June
June was abnormally inactive. It was the least active June since reliable records began, and one of the least active months in any given year on record, with only three named storms, all forming in the North Atlantic basin. This month started very late, with no storms developing until June 19, when Tropical Storm Alberto formed in the Bay of Campeche and made landfall in Ciudad Madero, Tamaulipas as a mild tropical storm. On June 28, Hurricane Beryl formed south of Cabo Verde and rapidly intensified into a major hurricane. It brushed through the Windward Islands as a high-end Category 4 major hurricane. Beryl entered the Caribbean Sea, and strengthened further into a Category 5 major hurricane, becoming the strongest tropical cyclone of this month. Tropical Depression Three formed on June 30 near Veracruz, becoming Tropical Storm Chris soon after. Chris would be short-lived as it made landfall in Tuxpan, Veracruz before it dissipated the next day.
July
July was moderately active, with seven systems and five of them being named, the month started with Tropical Storm Aletta, which formed off the coast of Mexico on July 4. On July 19, two tropical cyclones were formed on either side of the basin. Typhoon Gaemi formed east of Palau and peaked as a Category-4 typhoon on July 24, making it the strongest tropical cyclone of this month. Gaemi later made landfall on the northeastern coast of Taiwan as a Category-3 typhoon. Meanwhile, Severe Tropical Storm Prapiroon formed southeast of Manila and hit Hainan and Vietnam as a tropical storm. In the Eastern Pacific, short-lived Tropical Storm Bud unexpectedly formed off the southern tip of Baja California. A week later, Hurricane Carlotta formed off the coast of Mexico and became a Category-1 hurricane on August 2.
August
August was an above average month, featuring twenty-three systems, with sixteen being named. The month started on August 2, when a land depression developed over India in the North Indian basin. In the Eastern Pacific, a tropical cyclone outbreak saw the formation of three tropical storms in a quick session: Daniel on August 3, Emilia on August 4, and Fabio on August 5. Also on August 3, Hurricane Debby formed in the North Atlantic and made landfall near Steinhatchee, Florida as a mid-range hurricane. In the Western Pacific, Severe Tropical Storm Maria formed on August 5. About a week later, Tropical Storm Son-Tinh developed just southeast of Maria. It was later followed by the formations of Typhoon Ampil and Tropical Storm Wukong that both developed just a day of August 13. Back in the North Atlantic, Hurricane Ernesto developed southeast of Cabo Verde. It then traversed through the Leeward Islands and Puerto Rico as a tropical storm and made landfall in Bermuda as a Category 1 hurricane. On August 15, a rare early-season cyclone formed in the South-West Indian Ocean. Two days later, Tropical Storm Jongdari formed east of Taiwan and affected the Korean Peninsula. A day later, Hurricane Gilma developed south of Mexico. Activity continued in the Pacific with Typhoon Shanshan, which made landfall in Japan on August 30. On August 23, Hurricane Hone formed in the Central Pacific, becoming the first storm to form in the basin since Ema of 2019. Soon after, on August 25, Tropical Storm Hector was named. In the North Indian Ocean, Cyclone Asna formed between Madhya and Uttar Pradesh on August 30. On August 31, Typhoon Yagi formed, later affecting the Philippines and became a powerful Category 5 super typhoon in the South China Sea before striking northern Vietnam, becoming the strongest storm of the month.
September
September was very active, with twenty-two storms forming, and sixteen receiving names, with another system – 17W (Igme) – receiving a name that is deemed unofficial outside the Philippines. The month ramped off with Tropical Storm Leepi, which formed in the open Pacific Ocean. On September 9, Typhoon Bebinca and Hurricane Francine both formed in the West Pacific and Atlantic, respectively. A couple of days later, tropical storms Ileana, Gordon, Pulasan, and Soulik later joined the formation. On September 22, Hurricane John formed off the coast of southern Mexico and rapidly strengthened into a hurricane. It then made landfall in southern Mexico as a Category 3 hurricane. Simultaneously, on September 24, Tropical Storm Cimaron and Hurricane Helene formed on the same day, with Helene later becoming a major hurricane and made landfall over the Big Bend region in Florida two days later. Hurricanes Isaac and Kirk, Typhoon Krathon and tropical storms Jebi and Joyce also developed in the succeeding days. The month ended with the formation of Moderate Tropical Storm Ancha in the South-West Indian Ocean basin.
October
October was an average month, with fifteen systems forming, nine of which being officially named. The month kicked off with the formation of Tropical Depression Eleven-E in the Eastern Pacific Ocean basin on October 1. It was then followed by the formation of Hurricane Leslie in the Atlantic the next day. On October 5, two systems formed, Tropical Storm Barijat and Hurricane Milton on either side of the world, with Milton developing into one of the most powerful Atlantic hurricanes on record and the strongest storm worldwide in 2024 before making landfall in Florida as a Category 3 hurricane. In the third week of October, two tropical depressions formed in the North Indian Ocean, and another one in the Western Pacific. A few days later, on October 19, three systems simultaneously developed on both sides of the planet: Tropical Storm Nadine and Hurricane Oscar in the North Atlantic, and Tropical Storm Trami in the Northwestern Pacific. The cyclogenesis of Hurricane Kristy in the Eastern Pacific followed two days later – on October 21 – which formed partly from the remnants of Nadine. On the same day, a well-marked low pressure area developed over Andaman Sea in Bay of Bengal owing to a cyclonic circulation; it intensified into a tropical depression the very next day with deep convection, and eventually became Cyclone Dana on October 23. A day after Dana was named, Typhoon Kong-rey formed in the Western Pacific; initially located southeast of Guam, the storm later passed through Batanes before it made landfall in Chenggong, Taitung in Taiwan.
November
November was above-average, with twelve storms and eleven of them being named. The month started off with the formation of Tropical Storm Lane in the Eastern Pacific, followed by Tropical Storm Patty forming out of the open Atlantic. The next day, Typhoon Yinxing formed in the West Pacific, followed by Hurricane Rafael in the Atlantic. Two days later, the Western Pacific became more active as typhoons Toraji, Man-yi and Usagi formed, followed by Cyclone Bheki in the South-West Indian Ocean and Tropical Storm Sara in the Atlantic a few days later, in the Australian region, Cyclone Robyn forms, making it the first storm of the season, followed by Cyclone Fengal in the North Indian Ocean a week later.
December
December was an active month, featuring twelve storms forming. However, only three have been named, with another system – Querubin – receiving a name that is deemed unofficial outside of the Philippines. The month started with tropical lows 04U and 02U both forming in the Australian basin. Then in the Southwest Indian Ocean, Cyclone Chido formed and became the most intense cyclone this month, the costliest in the basin, and one of the deadliest storms of the year. Meanwhile, Subtropical Storm Biguá formed, becoming a rare South Atlantic tropical cyclone. Before the month ended, a tropical low formed to the west of Australia; initially designated by the Australian Bureau of Meteorology as Tropical Low 08U, it degenerated to a low on January 4 before crossing into the South-West Indian Ocean basin, where it reorganized and eventually became Cyclone Dikeledi.
Global effects
There are a total of seven tropical cyclone basins that tropical cyclones typically form in this table, data from all these basins are added.