


Related on Lably
The fundamental objectives of traditional cartography are to:
- Set the map's agenda and select traits of the object to be mapped. This is the concern of map editing. Traits may be physical, such as roads or land masses, or may be abstract, such as toponyms or political boundaries.
- Represent the terrain of the mapped object on flat media. This is the concern of map projections.
- Eliminate the mapped object's characteristics that are irrelevant to the map's purpose. This is the concern of generalization.
- Reduce the complexity of the characteristics that will be mapped. This is also the concern of generalization.
- Orchestrate the elements of the map to best convey its message to its audience. This is the concern of map design.
Modern cartography constitutes many theoretical and practical foundations of geographic information systems (GIS) and geographic information science (GISc).
History
Ancient times
What is the earliest known map is a matter of some debate, both because the term "map" is not well-defined and because some artifacts that might be maps might actually be something else. A wall painting that might depict the ancient Anatolian city of Çatalhöyük (previously known as Catal Huyuk or Çatal Hüyük) has been dated to the late 7th millennium BCE. Among the prehistoric alpine rock carvings of Mount Bego (France) and Valcamonica (Italy), dated to the 4th millennium BCE, geometric patterns consisting of dotted rectangles and lines are widely interpreted in archaeological literature as depicting cultivated plots. Other known maps of the ancient world include the Minoan "House of the Admiral" wall painting from c. 1600 BCE, showing a seaside community in an oblique perspective, and an engraved map of the holy Babylonian city of Nippur, from the Kassite period (14th – 12th centuries BCE). The oldest surviving world maps are from 9th century BCE Babylonia. One shows Babylon on the Euphrates, surrounded by Assyria, Urartu and several cities, all, in turn, surrounded by a "bitter river" (Oceanus). Another depicts Babylon as being north of the center of the world.
The ancient Greeks and Romans created maps from the time of Anaximander in the 6th century BCE. In the 2nd century CE, Ptolemy wrote his treatise on cartography, Geographia. This contained Ptolemy's world map – the world then known to Western society (Ecumene). As early as the 8th century, Arab scholars were translating the works of the Greek geographers into Arabic. Roads were essential in the Roman world, motivating the creation of maps, called itinerarium, that portrayed the world as experienced via the roads. The Tabula Peutingeriana is the only surviving example.
In ancient China, geographical literature dates to the 5th century BCE. The oldest extant Chinese maps come from the State of Qin, dated back to the 4th century BCE, during the Warring States period. In the book Xin Yi Xiang Fa Yao, published in 1092 by the Chinese scientist Su Song, a star map on the equidistant cylindrical projection. Although this method of charting seems to have existed in China even before this publication and scientist, the greatest significance of the star maps by Su Song is that they represent the oldest existent star maps in printed form.
Early forms of cartography of India included depictions of the pole star and surrounding constellations. These charts may have been used for navigation.
Middle Ages and Renaissance
Mappae mundi ('maps of the world') are the medieval European maps of the world. About 1,100 of these are known to have survived: of these, some 900 are found illustrating manuscripts, and the remainder exist as stand-alone documents.
The Arab geographer Muhammad al-Idrisi produced his medieval atlas Tabula Rogeriana (Book of Roger) in 1154. By combining the knowledge of Africa, the Indian Ocean, Europe, and the Far East (which he learned through contemporary accounts from Arab merchants and explorers) with the information he inherited from the classical geographers, he was able to write detailed descriptions of a multitude of countries. Along with the substantial text he had written, he created a world map influenced mostly by the Ptolemaic conception of the world, but with significant influence from multiple Arab geographers. It remained the most accurate world map for the next three centuries. The map was divided into seven climatic zones, with detailed descriptions of each zone. As part of this work, a smaller, circular map depicting the south on top and Arabia in the center was made. Al-Idrisi also made an estimate of the circumference of the world, accurate to within 10%.
In the Age of Discovery, from the 15th century to the 17th century, European cartographers both copied earlier maps (some of which had been passed down for centuries) and drew their own based on explorers' observations and new surveying techniques. The invention of the magnetic compass, telescope and sextant enabled increasing accuracy. In 1492, Martin Behaim, a German cartographer and advisor to the king John II of Portugal, made the oldest extant globe of the Earth.
In 1507, Martin Waldseemüller produced a globular world map and a large 12-panel world wall map (Universalis Cosmographia) bearing the first use of the name "America." Portuguese cartographer Diogo Ribero was the author of the first known planisphere with a graduated Equator (1527). Italian cartographer Battista Agnese produced at least 71 manuscript atlases of sea charts. Johannes Werner refined and promoted the Werner projection. This was an equal-area, heart-shaped world map projection (generally called a cordiform projection) that was used in the 16th and 17th centuries. Over time, other iterations of this map type arose; most notable are the sinusoidal projection and the Bonne projection. The Werner projection places its standard parallel at the North Pole; a sinusoidal projection places its standard parallel at the equator; and the Bonne projection is intermediate between the two.
In 1569, mapmaker Gerardus Mercator first published a map based on his Mercator projection, which uses equally-spaced parallel vertical lines of longitude and parallel latitude lines spaced farther apart as they get farther away from the equator. By this construction, courses of constant bearing are conveniently represented as straight lines for navigation. The same property limits its value as a general-purpose world map because regions are shown as increasingly larger than they actually are the further from the equator they are. Mercator is also credited as the first to use the word "atlas" to describe a collection of maps. In the later years of his life, Mercator resolved to create his Atlas, a book filled with many maps of different regions of the world, as well as a chronological history of the world from the Earth's creation by God until 1568. He was unable to complete it to his satisfaction before he died. Still, some additions were made to the Atlas after his death, and new editions were published after his death.
In 1570, the Brabantian cartographer Abraham Ortelius, strongly encouraged by Gillis Hooftman, created the first true modern atlas, Theatrum Orbis Terrarum. In a rare move, Ortelius credited mapmakers who contributed to the atlas, the list of which grew to 183 individuals by 1603.
In the Renaissance, maps were used to impress viewers and establish the owner's reputation as sophisticated, educated, and worldly. Because of this, towards the end of the Renaissance, maps were displayed with equal importance of painting, sculptures, and other pieces of art. In the sixteenth century, maps were becoming increasingly available to consumers through the introduction of printmaking, with about 10% of Venetian homes having some sort of map by the late 1500s.
There were three main functions of maps in the Renaissance:
- General descriptions of the world
- Navigation and wayfinding
- Land surveying and property management
In medieval times, written directions of how to get somewhere were more common than the use of maps. With the Renaissance, cartography began to be seen as a metaphor for power. Political leaders could lay claim to territories through the use of maps, and this was greatly aided by the religious and colonial expansion of Europe. The Holy Land and other religious places were the most commonly mapped during the Renaissance.
In the late 1400s to the late 1500s, Rome, Florence, and Venice dominated map-making and trade. It started in Florence in the mid-to late 1400s. Map trade quickly shifted to Rome and Venice but then was overtaken by atlas makers in the late 16th century. Map publishing in Venice was completed with humanities and book publishing in mind, rather than just informational use.
Printing technology
There were two main printmaking technologies in the Renaissance: woodcut and copper-plate intaglio, referring to the medium used to transfer the image onto paper.
In woodcut, the map image is created as a relief chiseled from medium-grain hardwood. The areas intended to be printed are inked and pressed against the sheet. Being raised from the rest of the block, the map lines cause indentations in the paper that can often be felt on the back of the map. There are advantages to using relief to make maps. For one, a printmaker doesn't need a press because the maps could be developed as rubbings. Identical reproductions might not have been achieved because the raised lines became fuzzy with use and different ink or paper could alter the appearance. Woodblock is durable enough to be used many times before defects appear. Existing printing presses can be used to create the prints rather than having to create a new one. On the other hand, it is hard to achieve fine detail with the relief technique. Inconsistencies in linework are more apparent in woodcut than in intaglio. To improve quality in the late fifteenth century, a style of relief craftsmanship developed using fine chisels to carve the wood, rather than the more commonly used knife.
In intaglio, lines are engraved into workable metals, typically copper but sometimes brass. The engraver spreads a thin sheet of wax over the metal plate and uses ink to draw the details. Then, the engraver traces the lines with a stylus to etch them into the plate beneath. The engraver can also use styli to prick holes along the drawn lines, trace along them with colored chalk, and then engrave the map. Lines going in the same direction are carved at the same time, and then the plate is turned to carve lines going in a different direction. To print from the finished plate, ink is spread over the metal surface and scraped off such that it remains only in the etched channels. Then the plate is pressed forcibly against the paper so that the ink in the channels is transferred to the paper. The pressing is so forceful that it leaves a "plate mark" around the border of the map at the edge of the plate, within which the paper is depressed compared to the margins. Copper and other metals were expensive at the time, so the plate was often reused for new maps or melted down for other purposes.
Whether woodcut or intaglio, the printed map is hung out to dry. Once dry, it is usually placed in another press to flatten the paper. Any type of paper that was available at the time could be used to print the map, but thicker paper was more durable.
Both relief and intaglio were used about equally by the end of the fifteenth century.
Lettering
Lettering in mapmaking is crucial for denoting information. Fine lettering is difficult in woodcut, where it often turned out square and blocky, contrary to the stylized, rounded writing style popular in Italy at the time. To improve quality, mapmakers developed fine chisels to carve the relief. Intaglio lettering did not suffer the troubles of a coarse medium and so was able to express the looping cursive that came to be known as cancellaresca. There were custom-made reverse punches that were also used in metal engraving alongside freehand lettering.
Color
The first use of color in map-making cannot be narrowed down to one reason. There are arguments that color started as a way to indicate information on the map, with aesthetics coming second. There are also arguments that color was first used on maps for aesthetics but then evolved into conveying information. Either way, many maps of the Renaissance left the publisher without being colored, a practice that continued all the way into the 1800s. However, most publishers accepted orders from their patrons to have their maps or atlases colored if they wished. Because all coloring was done by hand, the patron could request simple, cheap color, or more expensive, elaborate color, even going so far as silver or gold gilding. The simplest coloring was merely outlines, such as of borders and along rivers. Wash color meant painting regions with inks or watercolors. Limning meant adding silver and gold leaf to the map to illuminate lettering, heraldic arms, or other decorative elements.
Early modern period
The early modern period saw the convergence of cartographical techniques across Eurasia and the exchange of mercantile mapping techniques via the Indian Ocean.
In the early seventeenth century, the Selden map was created by a Chinese cartographer. Historians have put its date of creation around 1620, but there is debate in this regard. This map's significance draws from historical misconceptions of East Asian cartography, the main one being that East Asians did not do cartography until Europeans arrived. The map's depiction of trading routes, a compass rose, and scale bar points to the culmination of many map-making techniques incorporated into Chinese mercantile cartography.
In 1689, representatives of the Russian tsar and Qing Dynasty met near the border town of Nerchinsk, which was near the disputed border of the two powers, in eastern Siberia. The two parties, with the Qing negotiation party bringing Jesuits as intermediaries, managed to work a treaty which placed the Amur River as the border between the Eurasian powers, and opened up trading relations between the two. This treaty's significance draws from the interaction between the two sides, and the intermediaries who were drawn from a wide variety of nationalities.
Age of Enlightenment
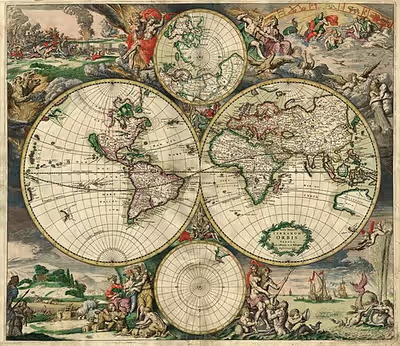
Maps of the Enlightenment period practically universally used copper plate intaglio, having abandoned the fragile, coarse woodcut technology. Use of map projections evolved, with the double hemisphere being very common and Mercator's prestigious navigational projection gradually making more appearances.
Due to the paucity of information and the immense difficulty of surveying during the period, mapmakers frequently plagiarized material without giving credit to the original cartographer. For example, a famous map of North America known as the "Beaver Map" was published in 1715 by Herman Moll. This map is a close reproduction of a 1698 work by Nicolas de Fer. De Fer, in turn, had copied images that were first printed in books by Louis Hennepin, published in 1697, and François Du Creux, in 1664. By the late 18th century, mapmakers often credited the original publisher with something along the lines of, "After [the original cartographer]" in the map's title or cartouche.
Modern period
In cartography, technology has continually changed in order to meet the demands of new generations of mapmakers and map users. The first maps were produced manually, with brushes and parchment; so they varied in quality and were limited in distribution. The advent of magnetic devices, such as the compass used for navigation and much later, magnetic storage devices, allowed for the creation of far more accurate maps and the ability to store and manipulate them digitally.
Advances in mechanical devices such as the Gutenberg printing press, quadrant, and vernier allowed the mass production of maps and the creation of accurate reproductions from more accurate data. Hartmann Schedel was one of the first cartographers to use the printing press to make maps more widely available. Optical technology, such as the telescope, sextant, and other devices that use telescopes, allowed accurate land surveys and allowed mapmakers and navigators to find their latitude by measuring angles to the pole star at night or the Sun at noon.
Advances in photochemical technology, such as the lithographic and photochemical processes, make possible maps with fine details, which do not distort in shape and which resist moisture and wear. This also eliminated the need for engraving, which further speeded up map production.
In the 20th century, aerial photography, satellite imagery, and remote sensing provided efficient, precise methods for mapping physical features, such as coastlines, roads, buildings, watersheds, and topography. The United States Geological Survey has devised multiple new map projections, notably the Space Oblique Mercator for interpreting satellite ground tracks for mapping the surface. The use of satellites and space telescopes now allows researchers to map other planets and moons in outer space. Advances in electronic technology ushered in another revolution in cartography: ready availability of computers and peripherals such as monitors, plotters, printers, scanners (remote and document) and analytic stereo plotters, along with computer programs for visualization, image processing, spatial analysis, and database management, have democratized and greatly expanded the making of maps. The ability to superimpose spatially located variables onto existing maps has created new uses for maps and new industries to explore and exploit these potentials. See also digital raster graphic.
In the early years of the new millennium, three key technological advances transformed cartography: the removal of Selective Availability in the Global Positioning System (GPS) in May 2000, which improved locational accuracy for consumer-grade GPS receivers to within a few metres; the invention of OpenStreetMap in 2004, a global digital counter-map that allowed anyone to contribute and use new spatial data without complex licensing agreements; and the launch of Google Earth in 2005 as a development of the virtual globe EarthViewer 3D (2004), which revolutionised accessibility of accurate world maps, as well as access to satellite and aerial imagery. These advances brought more accuracy to geographical and location-based data and widened the range of applications for cartography, for example in the development of satnav devices.
Today most commercial-quality maps are made using software of three main types: CAD, GIS and specialized illustration software. Spatial information can be stored in a database, from which it can be extracted on demand. These tools lead to increasingly dynamic, interactive maps that can be manipulated digitally.
On the other hand, we can observe a reverse trend. In contemporary times, there is a resurgence of interest in the most beautiful periods of cartography, with various maps being created using, for example, Renaissance-style aesthetics. We encounter imitators or continuators of Renaissance traditions that merge the realms of science and art. Among them are figures such as Luther Phillips (1891–1960) and Ruth Rhoads Lepper Gardner (1905–2011), who still operated using traditional cartographic methods, as well as creators utilizing modern developments based on GIS solutions and those employing techniques that combine advanced GIS/CAD methods with traditional artistic forms.
Field-rugged computers, GPS, and laser rangefinders make it possible to create maps directly from measurements made on site.
Sign in to keep reading
5 more chapters are free with a Lably account.
Deconstruction
There are technical and cultural aspects to producing maps. In this sense, maps can sometimes be said to be biased. The study of bias, influence, and agenda in making a map is what comprise a map's deconstruction. A central tenet of deconstructionism is that maps have power. Other assertions are that maps are inherently biased and that we search for metaphor and rhetoric in maps.
It is claimed that the Europeans promoted an "epistemological" understanding of the map as early as the 17th century. An example of this understanding is that "[European reproduction of terrain on maps] reality can be expressed in mathematical terms; that systematic observation and measurement offer the only route to cartographic truth…".
A common belief is that science heads in a direction of progress, and thus leads to more accurate representations of maps. In this belief, European maps must be superior to others, which necessarily employed different map-making skills. "There was a 'not cartography' land where lurked an army of inaccurate, heretical, subjective, valuative, and ideologically distorted images. Cartographers developed a 'sense of the other' in relation to nonconforming maps."
Depictions of Africa are a common target of deconstructionism. According to deconstructionist models, cartography was used for strategic purposes associated with imperialism and as instruments and representations of power during the conquest of Africa. The depiction of Africa and the low latitudes in general on the Mercator projection has been interpreted as imperialistic and as symbolic of subjugation due to the diminished proportions of those regions compared to higher latitudes where the European powers were concentrated.
Maps furthered imperialism and colonization of Africa in practical ways by showing basic information like roads, terrain, natural resources, settlements, and communities. Through this, maps made European commerce in Africa possible by showing potential commercial routes and made natural resource extraction possible by depicting locations of resources. Such maps also enabled military conquests and made them more efficient, and imperial nations further used them to put their conquests on display. These same maps were then used to cement territorial claims, such as at the Berlin Conference of 1884–1885.
Before 1749, maps of the African continent had African kingdoms drawn with assumed or contrived boundaries, with unknown or unexplored areas having drawings of animals, imaginary physical geographic features, and descriptive texts. In 1748, Jean B. B. d'Anville created the first map of the African continent that had blank spaces to represent the unknown territory.
Map types
General vs. thematic cartography
In understanding basic maps, the field of cartography can be divided into two general categories: general cartography and thematic cartography. General cartography involves those maps that are constructed for a general audience and thus contain a variety of features. General maps exhibit many reference and location systems and often are produced in a series. For example, the 1:24,000 scale topographic maps of the United States Geological Survey (USGS) are a standard as compared to the 1:50,000 scale Canadian maps. The government of the UK produces the classic 1:50,000 (replacing the older 1 inch to 1 mile) "Ordnance Survey" maps of the entire UK and with a range of correlated larger- and smaller-scale maps of great detail. Many private mapping companies have also produced thematic map series.
Thematic cartography involves maps of specific geographic themes, oriented toward specific audiences. A couple of examples might be a dot map showing corn production in Indiana or a shaded area map of Ohio counties, divided into numerical choropleth classes. As the volume of geographic data has exploded over the last century, thematic cartography has become increasingly useful and necessary to interpret spatial, cultural and social data.
A third type of map is known as an "orienteering," or special purpose map. This type of map falls somewhere between thematic and general maps. They combine general map elements with thematic attributes in order to design a map with a specific audience in mind. Oftentimes, the type of audience an orienteering map is made for is in a particular industry or occupation. An example of this kind of map would be a municipal utility map.
Topographic vs. topological
A topographic map is primarily concerned with the topographic description of a place, including (especially in the 20th and 21st centuries) the use of contour lines showing elevation. Terrain or relief can be shown in a variety of ways (see Cartographic relief depiction). In the present era, one of the most widespread and advanced methods used to form topographic maps is to use computer software to generate digital elevation models which show shaded relief. Before such software existed, cartographers had to draw shaded relief by hand. One cartographer who is respected as a master of hand-drawn shaded relief is the Swiss professor Eduard Imhof whose efforts in hill shading were so influential that his method became used around the world despite it being so labor-intensive.
A topological map is a very general type of map, the kind one might sketch on a napkin. It often disregards scale and detail in the interest of clarity of communicating specific route or relational information. Beck's London Underground map is an iconic example. Although the most widely used map of "The Tube," it preserves little of reality: it varies scale constantly and abruptly, it straightens curved tracks, and it contorts directions. The only topography on it is the River Thames, letting the reader know whether a station is north or south of the river. That and the topology of station order and interchanges between train lines are all that is left of the geographic space. Yet those are all a typical passenger wishes to know, so the map fulfills its purpose.
Map design
Modern technology, including advances in printing, the advent of geographic information systems and graphics software, and the Internet, has vastly simplified the process of map creation and increased the palette of design options available to cartographers. This has led to a decreased focus on production skill, and an increased focus on quality design, the attempt to craft maps that are both aesthetically pleasing and practically useful for their intended purposes.
Map purpose and audience
A map has a purpose and an audience. Its purpose may be as broad as teaching the major physical and political features of the entire world, or as narrow as convincing a neighbor to move a fence. The audience may be as broad as the general public or as narrow as a single person. Mapmakers use design principles to guide them in constructing a map that is effective for its purpose and audience.
Cartographic process
The cartographic process spans many stages, starting from conceiving the need for a map and extending all the way through its consumption by an audience. Conception begins with a real or imagined environment. As the cartographer gathers information about the subject, they consider how that information is structured and how that structure should inform the map's design. Next, the cartographers experiment with generalization, symbolization, typography, and other map elements to find ways to portray the information so that the map reader can interpret the map as intended. Guided by these experiments, the cartographer settles on a design and creates the map, whether in physical or electronic form. Once finished, the map is delivered to its audience. The map reader interprets the symbols and patterns on the map to draw conclusions and perhaps to take action. By the spatial perspectives they provide, maps help shape how we view the world.
Aspects of map design
Designing a map involves bringing together a number of elements and making a large number of decisions. The elements of design fall into several broad topics, each of which has its own theory, its own research agenda, and its own best practices. That said, there are synergistic effects between these elements, meaning that the overall design process is not just working on each element one at a time, but an iterative feedback process of adjusting each to achieve the desired gestalt.
- Map projections: The foundation of the map is the plane on which it rests (whether paper or screen), but projections are required to flatten the surface of the Earth or other celestial bodies. While all projections distort the surface, cartographers strategically control how and where distortion occurs For example, the popular Mercator projection does not distort angles on the surface, but it makes regions near the poles appear larger than they are.
- Generalization: All maps must be drawn at a smaller scale than reality, requiring that the information included on a map be a very small sample of the wealth of information about a place. Generalization is the process of adjusting the level of detail in geographic information to be appropriate for the scale and purpose of a map, through procedures such as selection, simplification, and classification.
- Symbology: Any map visually represents the location and properties of geographic phenomena using map symbols, graphical depictions composed of several visual variables, such as size, shape, color, and pattern.
- Composition: As all of the symbols are brought together, their interactions have major effects on map reading, such as grouping and visual hierarchy.
- Typography or labeling: Text serves a number of purposes on the map, especially aiding the recognition of features, but labels must be designed and positioned well to be effective.
- Layout: The map image must be placed on the page (whether paper, web, or other media), along with related elements, such as the title, legend, additional maps, text, images, and so on. Each of these elements have their own design considerations, as does their integration, which largely follows the principles of graphic design.
- Map type-specific design: Different kinds of maps, especially thematic maps, have their own design needs and best practices.
Deliberate cartographic errors
Some maps contain deliberate errors or distortions, either as propaganda or as a "watermark" to help the copyright owner identify infringement if the error appears in competitors' maps. The latter often come in the form of nonexistent, misnamed, or misspelled "trap streets". Other names and forms for this are paper towns, fictitious entries, and copyright easter eggs.
Another motive for deliberate errors is cartographic "vandalism": a mapmaker wishing to leave their mark on the work. Mount Richard, for example, was a fictitious peak on the Rocky Mountains' continental divide that appeared on a Boulder County, Colorado map in the early 1970s. It is believed to be the work of draftsman Richard Ciacci. The fiction was not discovered until two years later. In Switzerland's official maps, mapmakers have hidden illustrations of a hiker, fish, marmot, and more for over a century.
Sandy Island in New Caledonia is an example of a fictitious location that stubbornly survives, reappearing on new maps copied from older maps while being deleted from other new editions.
With the emergence of the internet and Web mapping, technologies allow for the creation and distribution of maps by people without proper cartographic training are readily available. This has led to maps that ignore cartographic conventions and are potentially misleading.
Professional and learned societies
Professional and learned societies include:
- International Cartographic Association (ICA), the world body for mapping and GIScience professionals, as well as the ICA member organizations
- British Cartographic Society (BCS) a registered charity in the UK dedicated to exploring and developing the world of maps
- Society of Cartographers supports in the UK the practising cartographer and encourages and maintains a high standard of cartographic illustration
- Cartography and Geographic Information Society (CaGIS), promotes in the U.S. research, education, and practice to improve the understanding, creation, analysis, and use of maps and geographic information. The society serves as a forum for the exchange of original concepts, techniques, approaches, and experiences by those who design, implement, and use cartography, geographical information systems, and related geospatial technologies.
- North American Cartographic Information Society (NACIS), A North American-based cartography society that is aimed at improving communication, coordination and cooperation among the producers, disseminators, curators, and users of cartographic information. Their members are located worldwide and the meetings are on an annual basis
- Canadian Cartographic Association (CCA)
Academic journals
Journals related to cartography, as well as GIS, GISc, include:
- International Journal of Cartography
- The Cartographic Journal
- Cartographica
- Cartography and Geographic Information Science
- Cartographic Perspectives
- KN - Journal of Cartography and Geographic Information
- Journal of Maps
- Journal of Geovisualization and Spatial Analysis
- Transactions in GIS
- Journal of Spatial Science
- Geocarto International
- GIScience & Remote Sensing
- International Journal of Applied Earth Observation and Geoinformation
- International Journal of Digital Earth
- Geoinformatica
- ISPRS International Journal of Geo-information
- Journal of Photogrammetry, Remote Sensing and Geoinformation Science
- Geo-spatial Information Science
- ACM Transactions on Spatial Algorithms and Systems
- Imago Mundi
- Revista Cartográfica
- Terrae Incognitae